The head and shoulders pattern is one of the most important concepts in technical analysis. It appears across stocks, indices, forex, and crypto, and it remains widely used because it reflects a clear shift in market psychology. Rather than predicting price, the pattern helps traders understand when control is transitioning between buyers and sellers.
This article explains what a head and shoulders pattern is, how it works in practice, and what trading strategies you can use when this setup forms in real markets.
What Is a Head and Shoulders Pattern?
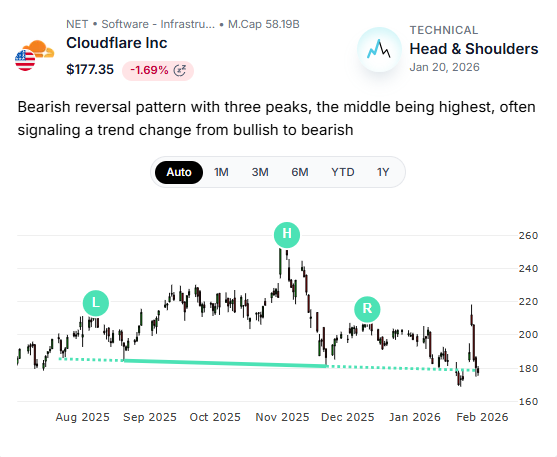
The head and shoulders pattern is a reversal candle chart formation that typically develops after a strong uptrend. It signals that bullish momentum is weakening and that a potential trend reversal may be forming.
The classic head and shoulders chart pattern consists of three price swings:
The left shoulder, where price rises and then pulls back.
The head, where price pushes to a higher high and then declines.
The right shoulder, where price rises again but fails to reach the head’s high.
A key component of the pattern is the neckline, which connects the pullback lows. When price breaks below this neckline, the head and shoulders trading pattern is considered confirmed.
This setup often appears after prolonged rallies, when buying pressure starts to fade.

Head and Shoulders Pattern: Bullish or Bearish?
The standard head and shoulders pattern is bearish. It reflects distribution, where early buyers begin to exit positions and new buyers are no longer strong enough to push prices higher. Each rally attempt becomes weaker, and once the neckline breaks, sellers typically take control.
In short, head and shoulder patterns show declining momentum, weakening volume, or broader market exhaustion before the breakdown occurs.
Inverse Head and Shoulders Pattern (Bullish Reversal)
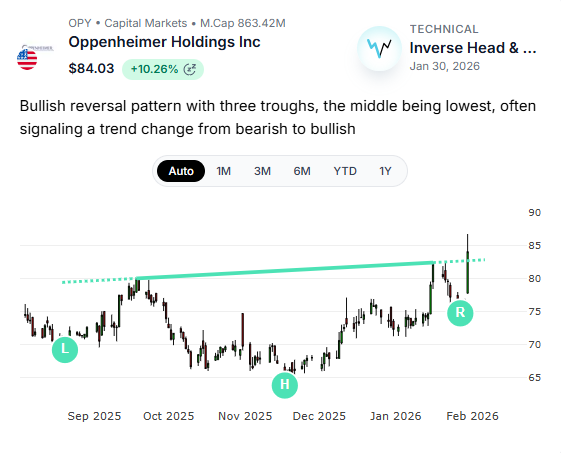
The inverse head and shoulders pattern, also called the inverted head and shoulders pattern, is the bullish counterpart.
Instead of forming after an uptrend, the inverse head and shoulders pattern appears after a downtrend and signals a potential bullish reversal. Its structure mirrors the classic pattern:
A left shoulder forms a temporary low.
The head forms a lower low.
The right shoulder forms a higher low.
The neckline connects the interim highs. When price breaks above the neckline, the inverse head and shoulders pattern is confirmed, often marking the start of a new uptrend.
This inverted head and shoulders pattern is widely used by traders searching for long positions and early reversal signals in oversold stocks.
Head and Shoulders Pattern in Stocks: How to Spot It
In technical analysis, stocks forming a head and shoulders pattern share one key characteristic: a mature trend that is losing strength.
Be careful, because not every three-peak structure qualifies as a valid head and shoulders chart pattern. Symmetry matters. The shoulders should be relatively balanced, the head should clearly stand out, and the neckline should be well defined. Patterns that form in choppy, sideways markets tend to fail more often.
This is why experienced traders treat the head and shoulders pattern as a contextual signal rather than a standalone trigger.
Automatically Finding Head and Shoulders Patterns with MarketAlerts
Understanding a technical pattern is one thing. Being able to spot them early enough to matter is much more difficult. Many traders spend hours manually scanning thousands of charts to find them, but this method is inefficient, exhausting, and susceptible to human error.
MarketAlerts solves this problem by using AI to continuously scan global markets for technical setups, including the head and shoulders pattern, the inverse head and shoulders pattern, and other key formations.
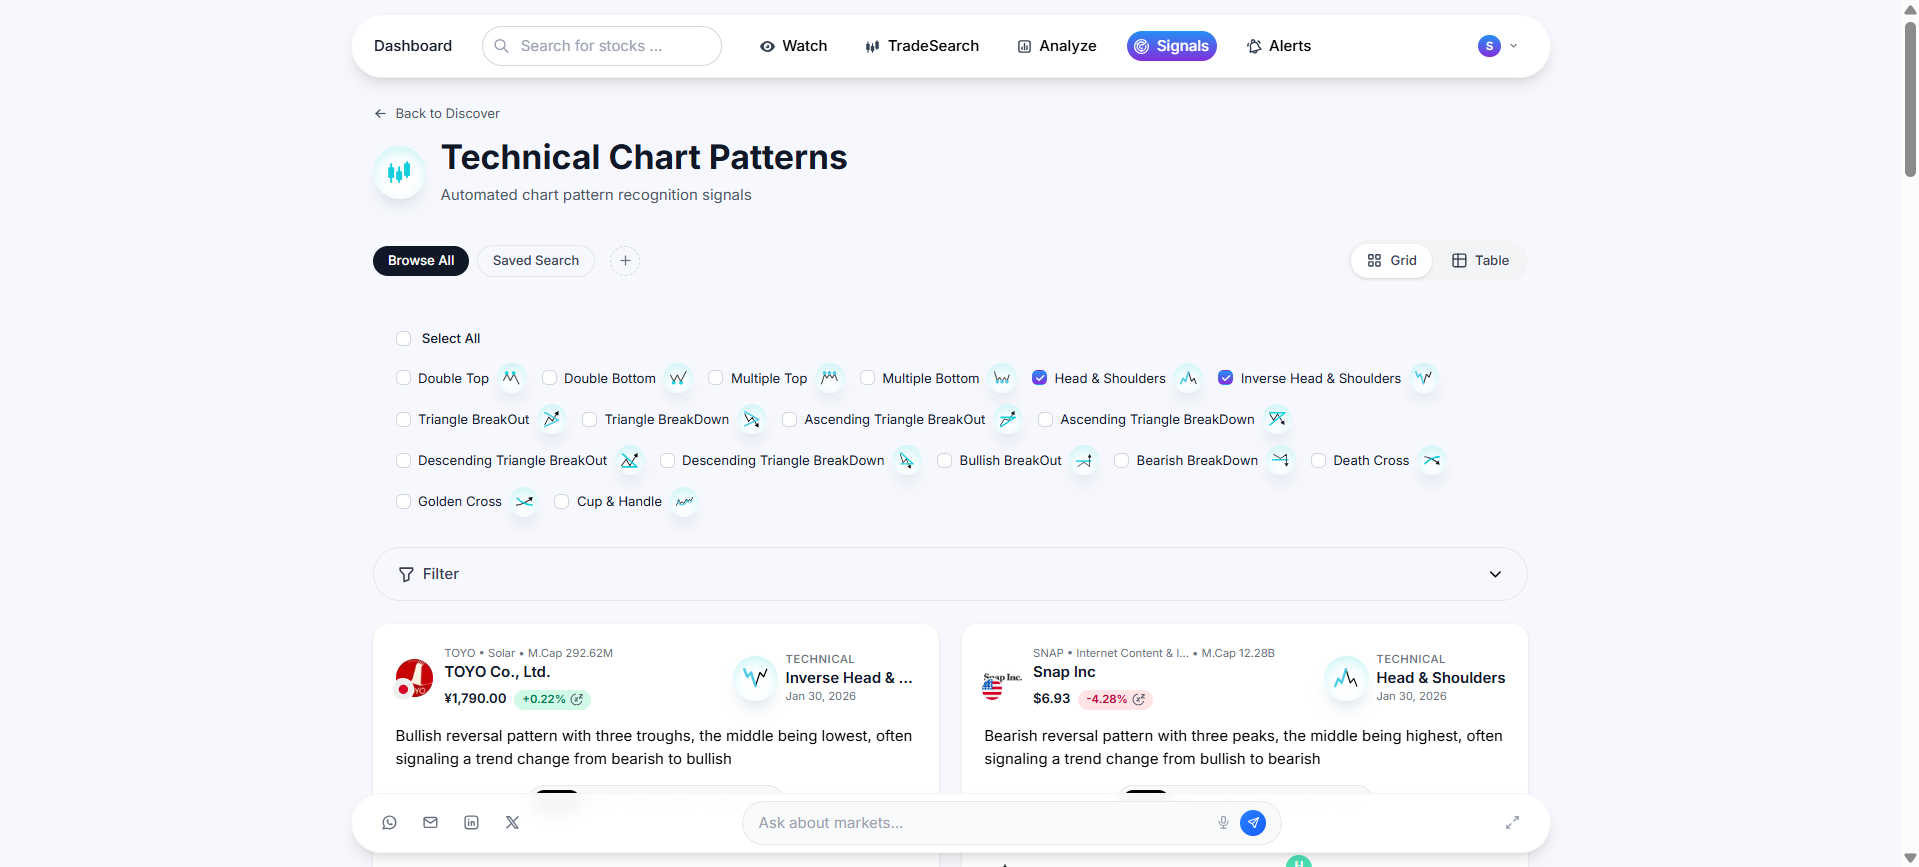
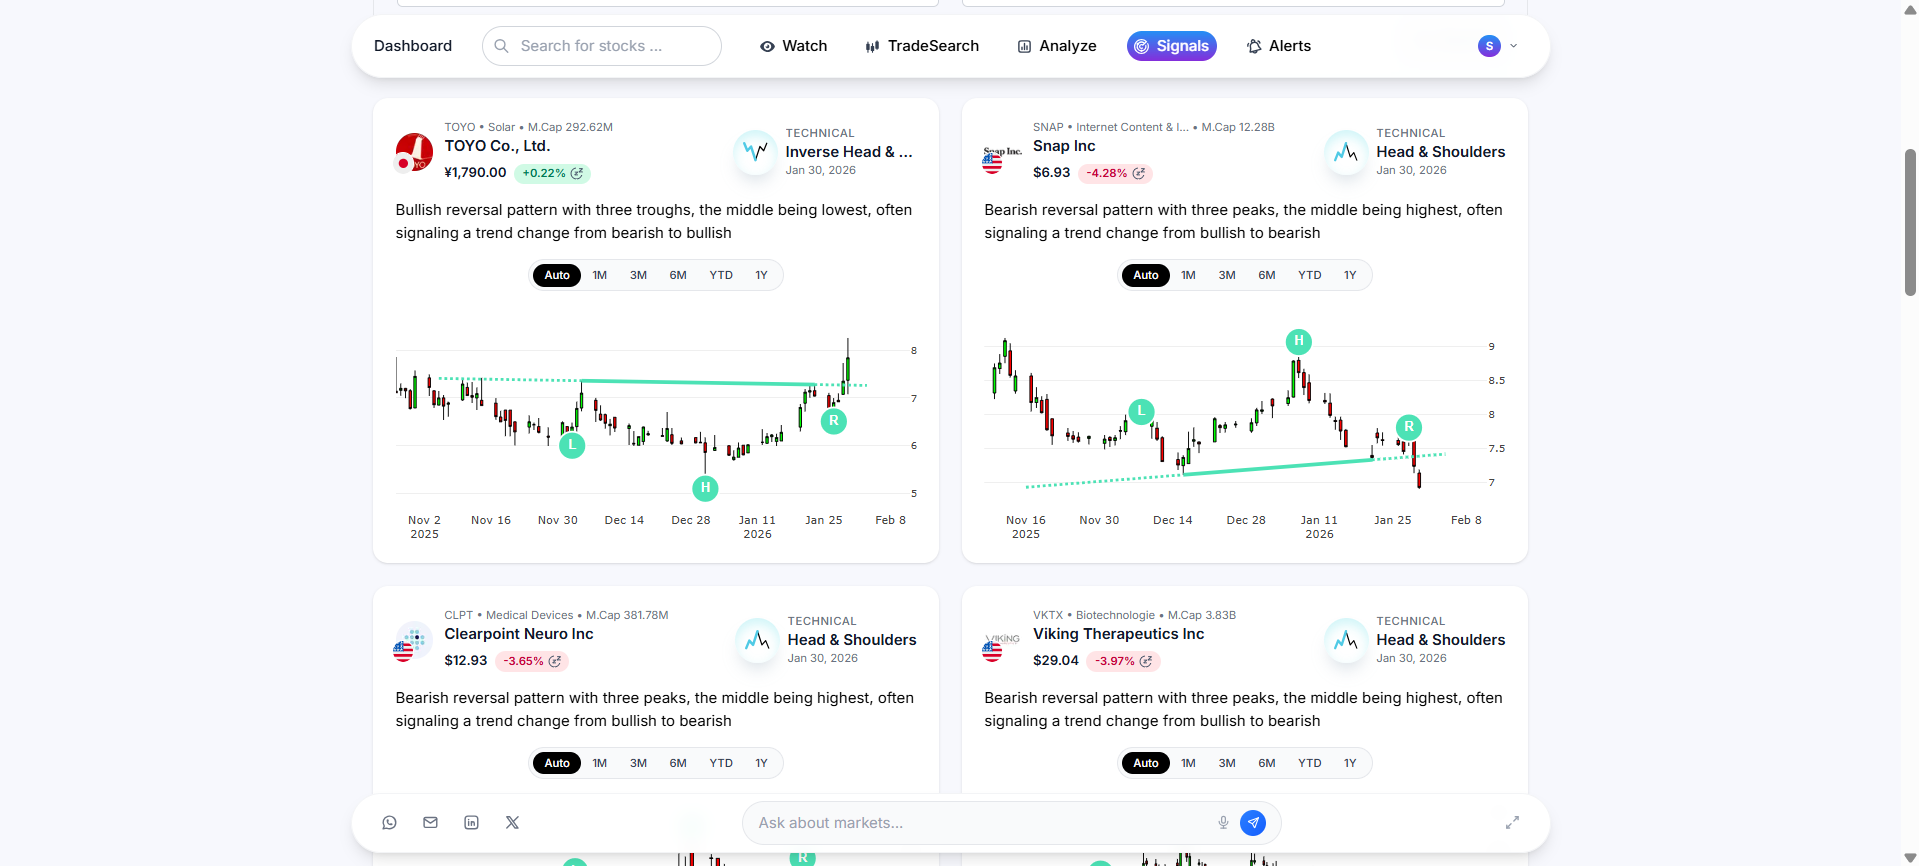
When a stock starts forming or confirms a head and shoulders trading pattern, MarketAlerts detects it and sends you a real-time alert. You can also browse the full stock market and apply filters to see which stocks are currently forming this setup.
In any case, this allows traders to act on opportunities as they develop, rather than discovering them after the move has already played out.
Create your free MarketAlerts account and start using AI to scan the market for head and shoulder pattern signals.
Head and Shoulders Pattern Trading Strategy
A disciplined head and shoulders pattern trading strategy focuses on confirmation and risk control.
Most traders wait for a decisive break of the neckline before entering a trade. More conservative traders wait for a retest of the neckline to reduce false breakouts. Profit targets are commonly estimated by measuring the distance from the head to the neckline and projecting that distance in the direction of the breakout.
Risk management is critical. In a bearish head and shoulders trading pattern, stops are typically placed above the right shoulder. In an inverse or inverted head and shoulders pattern, stops are often placed below the right shoulder.
Using the Head and Shoulders Pattern Properly
The head and shoulders pattern has endured for decades because it reflects genuine shifts in supply and demand. When understood correctly, it helps traders anticipate reversals instead of reacting late.
Used alongside sound technical analysis and supported by tools like MarketAlerts that automatically surface patterns across the market, the head and shoulders pattern becomes a practical, actionable signal rather than just a textbook example.
Never miss an opportunity again. Create your free MarketAlerts account and receive an alert every time a stock forms a head and shoulders pattern in real time.