Inverse Head & Shoulders Technical Pattern
Learn about the Bearish Head-and-Shoulders pattern in stock trading - a reversal pattern that signals potential downward movement. Understand how to identify and trade this technical analysis pattern effectively with volume analysis and key indicators.
Recent Inverse Head & Shoulders Patterns
15 patterns found
Ipsos S.A.
FR
Market Cap: 2.09B
Industry: Consulting Services
Inverse Head & Shoulders
4/14/2026
Bullish reversal pattern with three troughs, the middle being lowest, often signaling a trend change from bearish to bullish
Kingsoft Cloud Holdings Ltd
CN
Market Cap: 3.69B
Industry: Software - Application
Inverse Head & Shoulders
4/13/2026
Bullish reversal pattern with three troughs, the middle being lowest, often signaling a trend change from bearish to bullish
HONEST CO INC
US
Market Cap: 322.63M
Industry: Specialty Retail
Inverse Head & Shoulders
4/13/2026
Bullish reversal pattern with three troughs, the middle being lowest, often signaling a trend change from bearish to bullish
Accel Solutions Group Ltd
IL
Market Cap: 113.54M
Industry: Technology Distributors
Inverse Head & Shoulders
4/9/2026
Bullish reversal pattern with three troughs, the middle being lowest, often signaling a trend change from bearish to bullish
Metrocity Bankshares Inc
US
Market Cap: 741.36M
Industry: Banks - Regional
Inverse Head & Shoulders
4/9/2026
Bullish reversal pattern with three troughs, the middle being lowest, often signaling a trend change from bearish to bullish
American Superconductor Corp
US
Market Cap: 1.62B
Industry: Marine Shipping
Inverse Head & Shoulders
4/9/2026
Bullish reversal pattern with three troughs, the middle being lowest, often signaling a trend change from bearish to bullish
ONTO INNOVATION INC
US
Market Cap: 10.61B
Industry: Semiconductor Equipment & Materials
Inverse Head & Shoulders
4/8/2026
Bullish reversal pattern with three troughs, the middle being lowest, often signaling a trend change from bearish to bullish
Lotus Resources Ltd
CN
Market Cap: 753.36M
Industry: Industrial Materials
Inverse Head & Shoulders
4/8/2026
Bullish reversal pattern with three troughs, the middle being lowest, often signaling a trend change from bearish to bullish
2G Energy AG
DE
Market Cap: 707.79M
Industry: Specialty Industrial Machinery
Inverse Head & Shoulders
4/2/2026
Bullish reversal pattern with three troughs, the middle being lowest, often signaling a trend change from bearish to bullish
Flex Ltd
US
Market Cap: 24.15B
Industry: Other
Inverse Head & Shoulders
3/24/2026
Bullish reversal pattern with three troughs, the middle being lowest, often signaling a trend change from bearish to bullish
AdaptHealth LLC
US
Market Cap: 1.40B
Industry: Medical Devices
Inverse Head & Shoulders
3/24/2026
Bullish reversal pattern with three troughs, the middle being lowest, often signaling a trend change from bearish to bullish
Sportradar Group AG
CH
Market Cap: 5.26B
Industry: Software - Application
Inverse Head & Shoulders
3/19/2026
Bullish reversal pattern with three troughs, the middle being lowest, often signaling a trend change from bearish to bullish
SECURITY NATL FINL CORP
US
Market Cap: 234.20M
Industry: Mortgage Finance
Inverse Head & Shoulders
3/17/2026
Bullish reversal pattern with three troughs, the middle being lowest, often signaling a trend change from bearish to bullish
VIKING THERAPEUTICS INC
US
Market Cap: 3.59B
Industry: Medical - Pharmaceuticals
Inverse Head & Shoulders
3/16/2026
Bullish reversal pattern with three troughs, the middle being lowest, often signaling a trend change from bearish to bullish
BIOMEA FUSION INC
US
Market Cap: 110.62M
Industry: Biotechnology
Inverse Head & Shoulders
3/11/2026
Bullish reversal pattern with three troughs, the middle being lowest, often signaling a trend change from bearish to bullish
Want to see more technical patterns?
Access our full platform with advanced filtering, real-time alerts, and comprehensive market analysis.
View Full Platform →About Inverse Head & Shoulders Patterns
Inverse Head & Shoulders patterns are technical chart formations that traders and investors use to identify potential entry and exit points. These patterns are based on historical price movements and can help predict future price direction.
Understanding the Bearish Head-and-Shoulders in Stocks
What is the Bearish Head-and-Shoulders Pattern in Stocks?
The Bearish Head-and-Shoulders pattern is a reversal pattern that appears at the end of an uptrend, indicating a potential downward movement. This pattern forms when the price of a stock creates three successive peaks, with the middle peak (head) being the highest, flanked by two lower peaks (shoulders). In stock trading, the Bearish Head-and-Shoulders pattern is significant because it often marks the end of a bullish phase and the beginning of a bearish trend. Recognizing this pattern can help traders anticipate price movements and make strategic trades.
How to Identify Bearish Head-and-Shoulders Patterns
Identifying the Bearish Head-and-Shoulders pattern involves several key steps:
- Initial Uptrend: Look for a clear uptrend where the price reaches new highs.
- Left Shoulder: The price hits a high point, falls, and then rises again.
- Head: The price forms a higher high than the left shoulder and falls again.
- Right Shoulder: The price forms a lower high, similar to the left shoulder, and then falls.
- Neckline Breakout: The price breaks below the neckline, confirming the pattern.
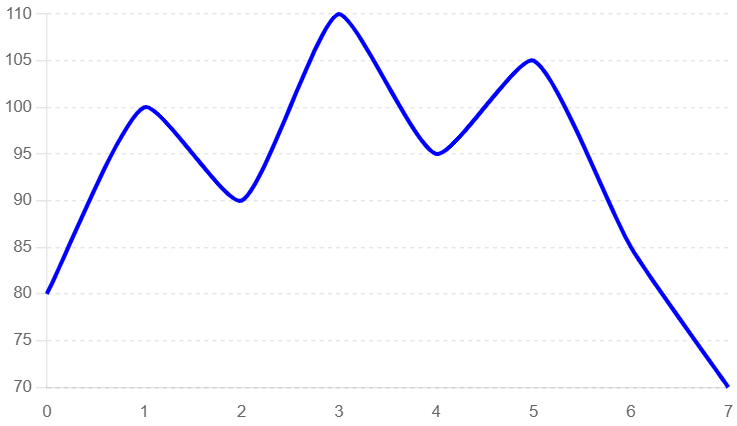
Identifying a Bearish Head-and-Shoulders Pattern
In this example, we use a typical candlestick chart to illustrate the formation of a Bearish Head-and-Shoulders pattern. Key elements to observe include the initial uptrend, the formation of the left shoulder, head, and right shoulder, and the subsequent breakout.
- Initial Uptrend: The price of the stock shows a clear uptrend, indicating bullish market sentiment.
- Left Shoulder: The price hits a high point and then falls.
- Head: The price forms a higher high and then falls.
- Right Shoulder: The price forms a lower high, similar to the left shoulder, and then falls.
- Breakout Confirmation: The price breaks below the neckline, confirming the pattern.
Bearish Head-and-Shoulders Pattern
Key Indicators
- Candlestick Patterns: Look for reversal candlestick patterns near the shoulders.
- Volume Spikes: Increased trading volume often accompanies the breakout, indicating strong selling interest.
- Resistance Levels: The shoulders should align with significant resistance levels on the chart.
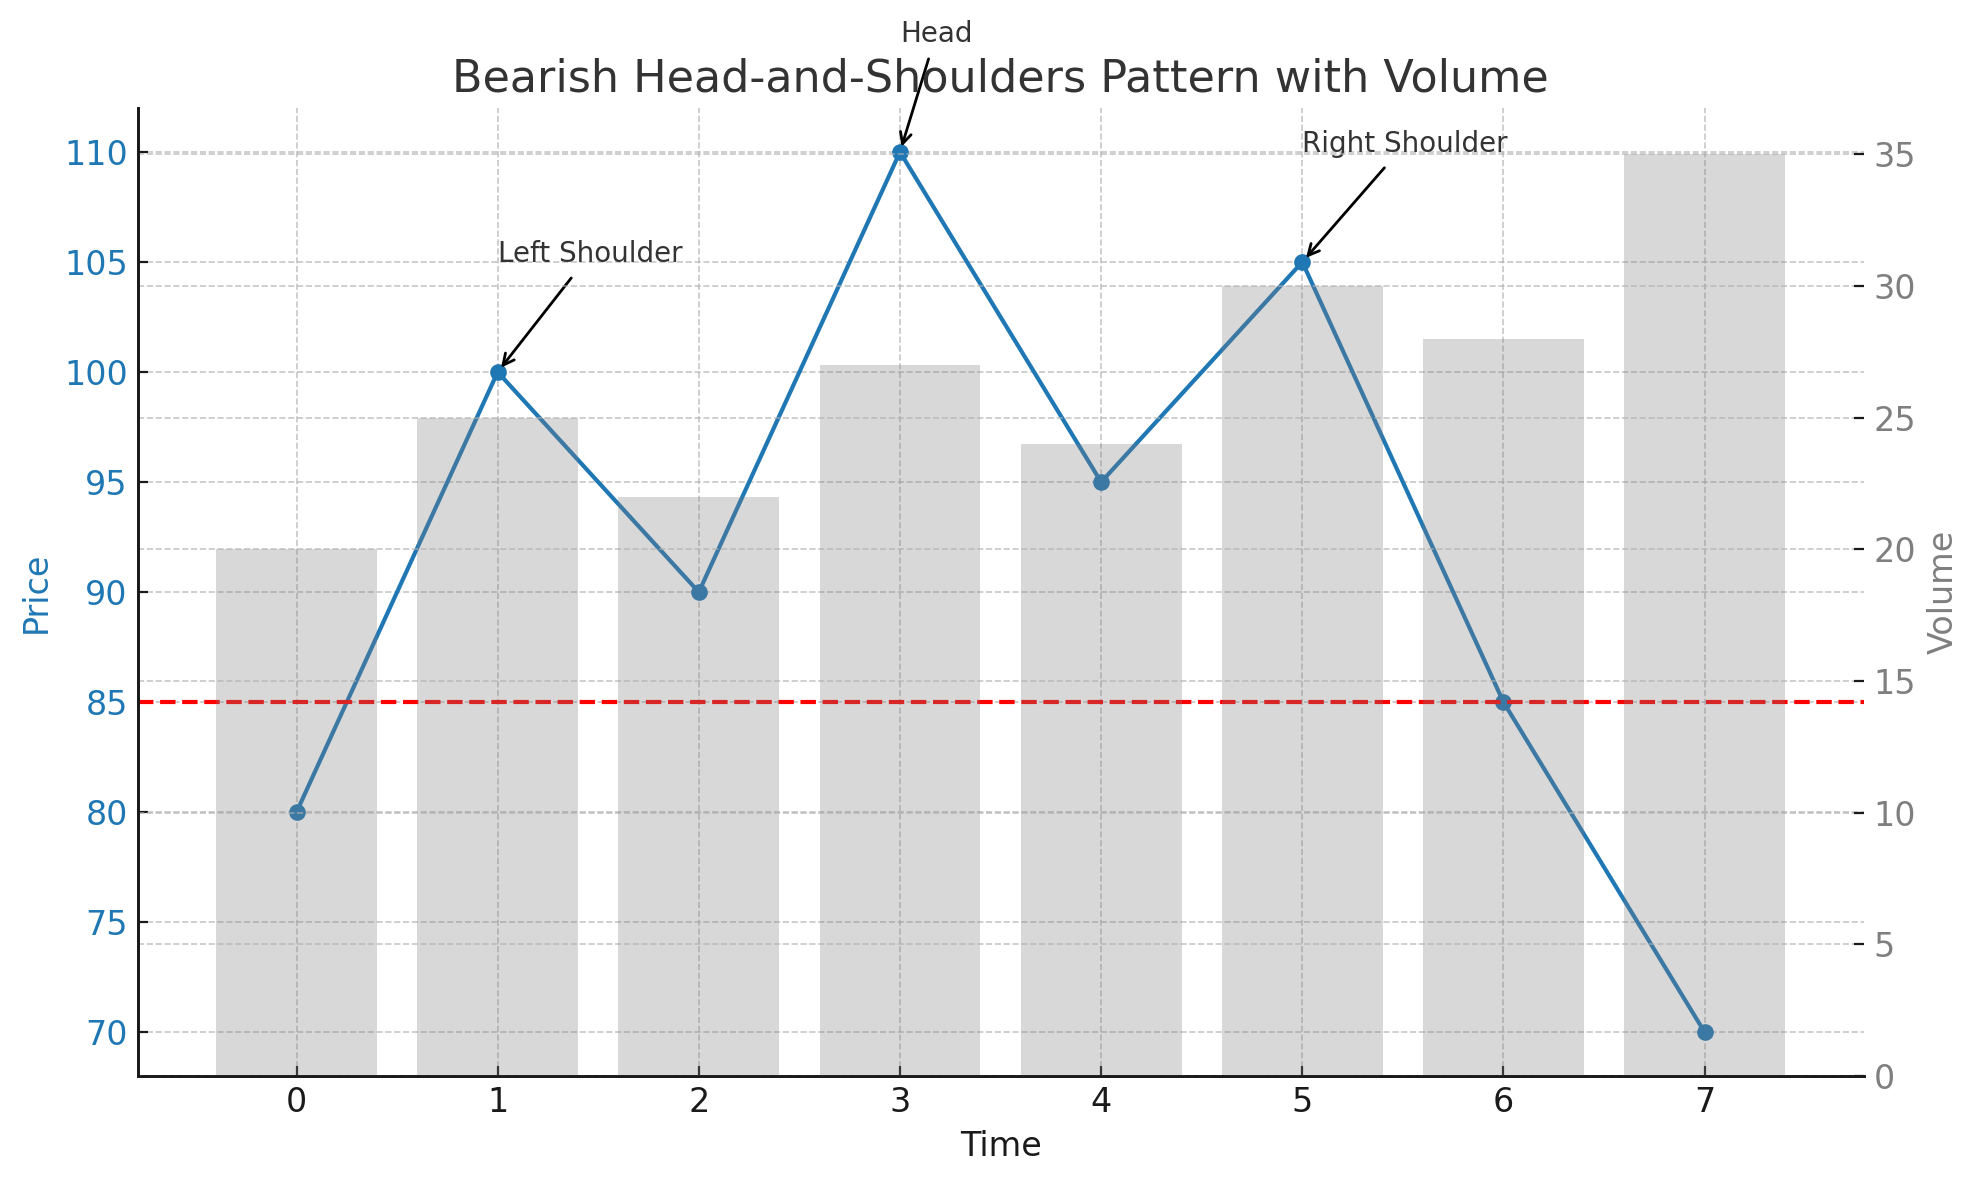
Bearish Head-and-Shoulders Pattern with Volume Analysis
This example highlights the role of volume in confirming the Bearish Head-and-Shoulders pattern. Volume analysis can provide additional confidence in the pattern's validity.
- Initial Uptrend: The price trend is upward, characterized by increasing prices and moderate volume.
- Left Shoulder: The price hits a high point with moderate volume as sellers begin to enter the market.
- Head: The price forms a higher high with moderate volume and then falls.
- Right Shoulder: The price forms a lower high with moderate volume and then falls.
- Breakout: The price breaks below the neckline with a significant spike in volume, confirming the pattern.
Bearish Head-and-Shoulders Pattern with Volume
Frequently Asked Questions
What is the Bearish Head-and-Shoulders pattern in stock trading?
The Bearish Head-and-Shoulders pattern in stock trading is a reversal pattern that appears at the end of an uptrend. It indicates a potential downward movement and is characterized by the price forming three successive peaks, with the middle peak being the highest, flanked by two lower peaks.
How reliable is the Bearish Head-and-Shoulders pattern in stocks?
The Bearish Head-and-Shoulders pattern is considered a reliable bearish reversal signal in stock trading, especially when confirmed by increased trading volume and a strong breakout below the neckline. However, it should be used alongside other technical analysis tools.
Can the Bearish Head-and-Shoulders pattern appear in any stock?
Yes, the Bearish Head-and-Shoulders pattern can appear in any stock. It is a widely applicable chart pattern used in technical analysis across various assets, including stocks.
What common mistakes should be avoided when trading the Bearish Head-and-Shoulders pattern?
Common mistakes include entering the trade too early before the neckline breakout confirmation, not confirming the pattern with volume analysis, and failing to set appropriate stop-loss levels to manage risk. By understanding and utilizing the Bearish Head-and-Shoulders pattern, traders can better anticipate bearish reversals and optimize their trading strategies for improved outcomes in the stock market.
What are the key indicators to consider when trading the Bearish Head-and-Shoulders pattern in stocks?
Key indicators include identifying significant resistance levels, confirming the pattern with increased volume during the breakout, and observing reversal candlestick patterns near the shoulders. These indicators help validate the Bearish Head-and-Shoulders pattern and provide insights for potential significant price movements.