Multiple Top Technical Pattern
Learn about the Multiple Top pattern in stock trading - a bearish reversal pattern that signals potential downward movement. Understand how to identify and trade this technical analysis pattern effectively with volume analysis and key indicators.
Recent Multiple Top Patterns
15 patterns found
HUNTSMAN CORP
US
Market Cap: 2.19B
Industry: Other
Multiple Top
4/13/2026
Bearish pattern with three or more peaks at similar price levels, indicating strong resistance
CONCRETE PUMPING HLDGS INC
US
Market Cap: 393.79M
Industry: Engineering & Construction
Multiple Top
4/13/2026
Bearish pattern with three or more peaks at similar price levels, indicating strong resistance
Premier Foods plc
GB
Market Cap: 2.21B
Industry: Packaged Foods
Multiple Top
4/13/2026
Bearish pattern with three or more peaks at similar price levels, indicating strong resistance
Construcciones y Auxiliar de Ferrocarriles S.A
ES
Market Cap: 1.41B
Industry: Railroads
Multiple Top
4/10/2026
Bearish pattern with three or more peaks at similar price levels, indicating strong resistance
Levi Strauss & Co
US
Market Cap: 8.93B
Industry: Apparel - Retail
Multiple Top
4/10/2026
Bearish pattern with three or more peaks at similar price levels, indicating strong resistance
Ashtrom Group Ltd
IL
Market Cap: 2.68B
Industry: Real Estate - Development
Multiple Top
4/10/2026
Bearish pattern with three or more peaks at similar price levels, indicating strong resistance
EUROCOMM.PR. CERT.10EO 10
NL
Market Cap: 1.77B
Industry: REIT - Retail
Multiple Top
4/10/2026
Bearish pattern with three or more peaks at similar price levels, indicating strong resistance
REPUBLIC BANCORP INC
US
Market Cap: 1.40B
Industry: Banks - Regional
Multiple Top
4/10/2026
Bearish pattern with three or more peaks at similar price levels, indicating strong resistance
WYNDHAM HOTELS & RESORTS INC
US
Market Cap: 6.49B
Industry: Travel Lodging
Multiple Top
4/10/2026
Bearish pattern with three or more peaks at similar price levels, indicating strong resistance
IMCD NV
NL
Market Cap: 9.95B
Industry: Chemicals - Specialty
Multiple Top
4/10/2026
Bearish pattern with three or more peaks at similar price levels, indicating strong resistance
Ovh Groupe SAS
FR
Market Cap: 1.50B
Industry: Software - Infrastructure
Multiple Top
4/10/2026
Bearish pattern with three or more peaks at similar price levels, indicating strong resistance
PURECYCLE CORP
US
Market Cap: 258.73M
Industry: Utilities - Regulated Water
Multiple Top
4/10/2026
Bearish pattern with three or more peaks at similar price levels, indicating strong resistance
Airtel Africa Plc
GB
Market Cap: 15.32B
Industry: Telecom Services
Multiple Top
4/10/2026
Bearish pattern with three or more peaks at similar price levels, indicating strong resistance
Sdiptech AB
SE
Market Cap: 894.95M
Industry: Industrial - Infrastructure Operations
Multiple Top
4/10/2026
Bearish pattern with three or more peaks at similar price levels, indicating strong resistance
Kronos Worldwide Inc
US
Market Cap: 701.82M
Industry: Specialty Chemicals
Multiple Top
4/10/2026
Bearish pattern with three or more peaks at similar price levels, indicating strong resistance
Want to see more technical patterns?
Access our full platform with advanced filtering, real-time alerts, and comprehensive market analysis.
View Full Platform →About Multiple Top Patterns
Multiple Top patterns are technical chart formations that traders and investors use to identify potential entry and exit points. These patterns are based on historical price movements and can help predict future price direction.
Understanding the Multiple Top in Stocks
What is the Multiple Top Pattern in Stocks?
The Multiple Top pattern is a bearish reversal pattern that appears at the end of an uptrend, indicating a potential downward movement. This pattern forms when the price of a stock hits a high multiple times before declining. It resembles the shape of several "M" formations on a price chart. In stock trading, the Multiple Top pattern is significant because it often marks the end of a bullish phase and the beginning of a bearish trend. Recognizing this pattern can help traders anticipate price movements and make strategic trades.
How to Identify Multiple Top Patterns
Identifying the Multiple Top pattern involves several key steps:
- Initial Uptrend: Look for a clear uptrend where the price reaches new highs.
- Multiple Tops: Observe the price hitting high points multiple times and declining to form lows.
- Confirmation: After the last top, the price should decline and break below the lows formed between the tops, confirming the pattern.
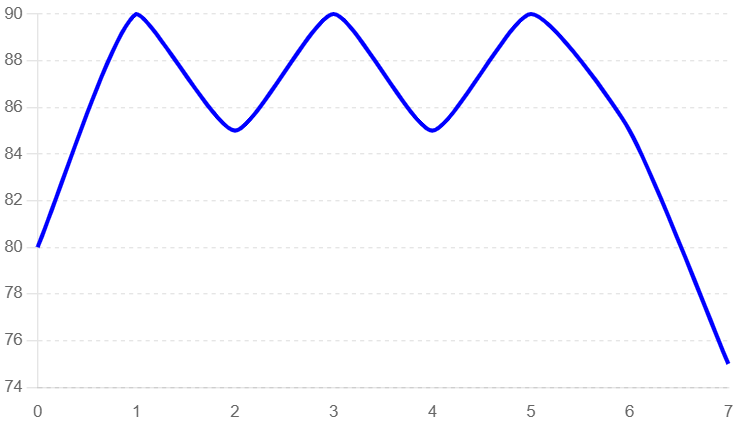
Identifying a Multiple Top Pattern
In this example, we use a typical candlestick chart to illustrate the formation of a Multiple Top pattern. Key elements to observe include the initial uptrend, the formation of the multiple tops, and the subsequent breakout.
- Initial Uptrend: The price of the stock shows a clear uptrend, indicating bullish market sentiment.
- Multiple Tops: The price hits high points (Points A, B, C, etc.) and then declines to form lows.
- Breakout Confirmation: After the final top, the price declines and breaks below the lows formed between the tops, confirming the pattern.
Multiple Top Pattern
Key Indicators
- Candlestick Patterns: Look for reversal candlestick patterns near the tops.
- Volume Spikes: Increased trading volume often accompanies the breakout, indicating strong selling interest.
- Resistance Levels: The tops should align with significant resistance levels on the chart.
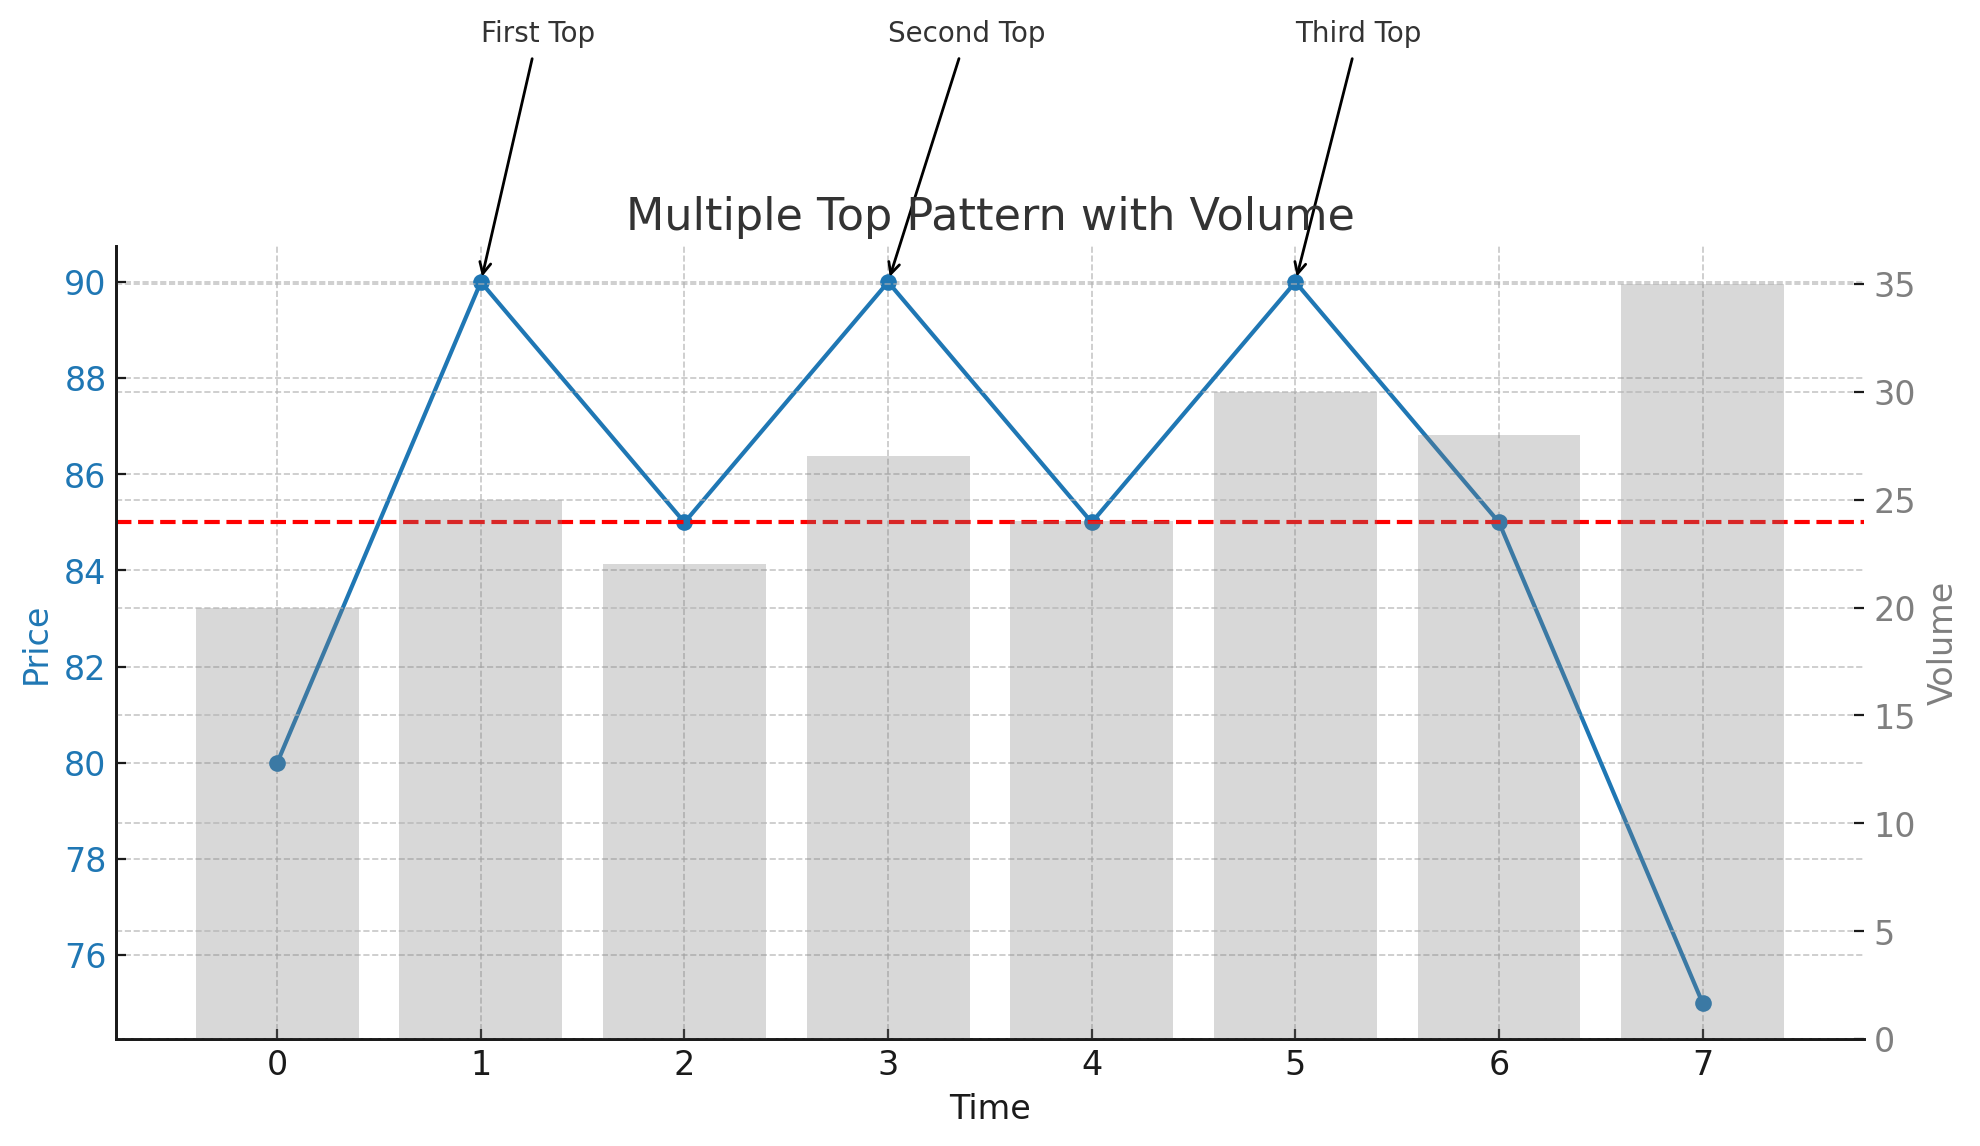
Multiple Top Pattern with Volume Analysis
This example highlights the role of volume in confirming the Multiple Top pattern. Volume analysis can provide additional confidence in the pattern's validity.
- Initial Uptrend: The price trend is upward, characterized by increasing prices and moderate volume.
- Multiple Tops: The price reaches high points with moderate volume as sellers begin to enter the market.
- Rebound to Lows: The price declines from each top, but volume remains moderate.
- Breakout Confirmation: The price declines and breaks below the lows formed between the tops, accompanied by a significant spike in volume, confirming the pattern.
Multiple Top Pattern with Volume
Frequently Asked Questions
What is the Multiple Top pattern in stock trading?
The Multiple Top pattern in stock trading is a bearish reversal pattern that appears at the end of an uptrend. It indicates a potential downward movement and is characterized by the price hitting a high point multiple times before declining.
How reliable is the Multiple Top pattern in stocks?
The Multiple Top pattern is considered a reliable bearish reversal signal in stock trading, especially when confirmed by increased trading volume and a strong breakout below the lows formed between the tops. However, it should be used alongside other technical analysis tools.
Can the Multiple Top pattern appear in any stock?
Yes, the Multiple Top pattern can appear in any stock. It is a widely applicable chart pattern used in technical analysis across various assets, including stocks.
What common mistakes should be avoided when trading the Multiple Top pattern?
Common mistakes include entering the trade too early before the breakout confirmation, not confirming the pattern with volume analysis, and failing to set appropriate stop-loss levels to manage risk. By understanding and utilizing the Multiple Top pattern, traders can better anticipate bearish reversals and optimize their trading strategies for improved outcomes in the stock market.
What are the key indicators to consider when trading the Multiple Top pattern in stocks?
Key indicators include identifying significant resistance levels, confirming the pattern with increased volume during the breakout, and observing reversal candlestick patterns near the tops. These indicators help validate the Multiple Top pattern and provide insights for potential significant price movements.