Multiple Bottom Technical Pattern
Learn about the Multiple Bottom pattern in stock trading - a bullish reversal pattern that signals potential upward movement. Understand how to identify and trade this technical analysis pattern effectively with volume analysis and key indicators.
Recent Multiple Bottom Patterns
15 patterns found
SEALSQ CORP
CH
Market Cap: 288.96M
Industry: Semiconductors
Multiple Bottom
4/13/2026
Bullish pattern with three or more troughs at similar price levels, suggesting strong support
Marqeta Inc
US
Market Cap: 1.86B
Industry: Software - Infrastructure
Multiple Bottom
4/13/2026
Bullish pattern with three or more troughs at similar price levels, suggesting strong support
Quirin Privatbank AG
DE
Market Cap: 170.40M
Industry: Other
Multiple Bottom
4/13/2026
Bullish pattern with three or more troughs at similar price levels, suggesting strong support
Central Asia Metals plc
GB
Market Cap: 500.88M
Industry: Other
Multiple Bottom
4/13/2026
Bullish pattern with three or more troughs at similar price levels, suggesting strong support
Cantargia AB
SE
Market Cap: 106.07M
Industry: Biotechnology
Multiple Bottom
4/13/2026
Bullish pattern with three or more troughs at similar price levels, suggesting strong support
Stabilis Energy Inc
US
Market Cap: 104.51M
Industry: Oil & Gas Integrated
Multiple Bottom
4/13/2026
Bullish pattern with three or more troughs at similar price levels, suggesting strong support
VIPSHOP HOLDINGS LIMITED
CN
Market Cap: 7.49B
Industry: Specialty Retail
Multiple Bottom
4/13/2026
Bullish pattern with three or more troughs at similar price levels, suggesting strong support
MONTROSE ENVIRONMENTAL GROUP INC
US
Market Cap: 754.38M
Industry: Waste Management
Multiple Bottom
4/13/2026
Bullish pattern with three or more troughs at similar price levels, suggesting strong support
Sun Silver Limited
AU
Market Cap: 148.65M
Industry: Silver
Multiple Bottom
4/13/2026
Bullish pattern with three or more troughs at similar price levels, suggesting strong support
Ab S.a.
PL
Market Cap: 528.34M
Industry: Technology Distributors
Multiple Bottom
4/10/2026
Bullish pattern with three or more troughs at similar price levels, suggesting strong support
Avalo Therapeutics Inc
US
Market Cap: 190.48M
Industry: Biotechnology
Multiple Bottom
4/10/2026
Bullish pattern with three or more troughs at similar price levels, suggesting strong support
UIPATH INC
US
Market Cap: 5.78B
Industry: Software - Infrastructure
Multiple Bottom
4/10/2026
Bullish pattern with three or more troughs at similar price levels, suggesting strong support
Iveco Group NV
IT
Market Cap: 5.93B
Industry: Agricultural - Machinery
Multiple Bottom
4/10/2026
Bullish pattern with three or more troughs at similar price levels, suggesting strong support
BRDR. A+O JOH. B DK 1
DK
Market Cap: 369.41M
Industry: Industrial - Distribution
Multiple Bottom
4/10/2026
Bullish pattern with three or more troughs at similar price levels, suggesting strong support
AKAMAI TECHNOLOGIES INC
US
Market Cap: 17.34B
Industry: Software - Services
Multiple Bottom
4/10/2026
Bullish pattern with three or more troughs at similar price levels, suggesting strong support
Want to see more technical patterns?
Access our full platform with advanced filtering, real-time alerts, and comprehensive market analysis.
View Full Platform →About Multiple Bottom Patterns
Multiple Bottom patterns are technical chart formations that traders and investors use to identify potential entry and exit points. These patterns are based on historical price movements and can help predict future price direction.
Understanding the Multiple Bottom in Stocks
What is the Multiple Bottom Pattern in Stocks?
The Multiple Bottom pattern is a bullish reversal pattern that appears at the end of a downtrend, indicating a potential upward movement. This pattern forms when the price of a stock hits a low multiple times before rising again. It resembles the shape of several "W" formations on a price chart. In stock trading, the Multiple Bottom pattern is significant because it often marks the end of a bearish phase and the beginning of a bullish trend. Recognizing this pattern can help traders anticipate price movements and make strategic trades.
How to Identify Multiple Bottom Patterns
Identifying the Multiple Bottom pattern involves several key steps:
- Initial Decline: Look for a clear downtrend where the price reaches new lows.
- Multiple Bottoms: Observe the price hitting low points multiple times and rebounding to form peaks.
- Confirmation: After the last bottom, the price should rise and break above the peaks formed between the bottoms, confirming the pattern.
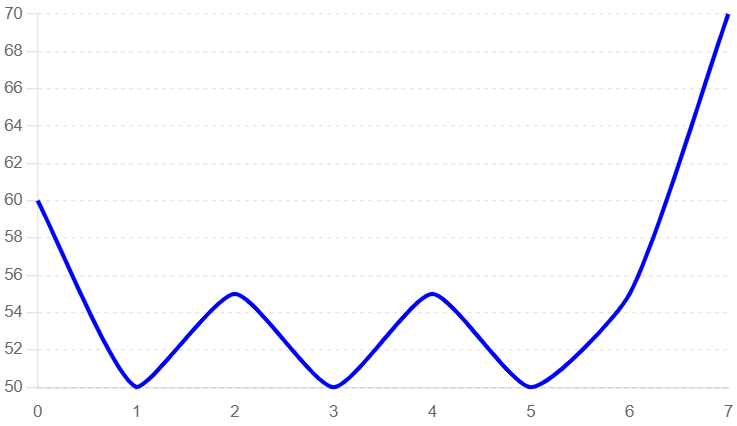
Identifying a Multiple Bottom Pattern
In this example, we use a typical candlestick chart to illustrate the formation of a Multiple Bottom pattern. Key elements to observe include the initial decline, the formation of the multiple bottoms, and the subsequent breakout.
- Initial Decline: The price of the stock shows a clear downtrend, indicating bearish market sentiment.
- Multiple Bottoms: The price hits low points (Points A, B, C, etc.) and then rebounds to form peaks.
- Breakout Confirmation: After the final bottom, the price rises and breaks above the peaks formed between the bottoms, confirming the pattern.
Multiple Bottom Pattern
Key Indicators
- Candlestick Patterns: Look for reversal candlestick patterns near the bottoms.
- Volume Spikes: Increased trading volume often accompanies the breakout, indicating strong buying interest.
- Support Levels: The bottoms should align with significant support levels on the chart.
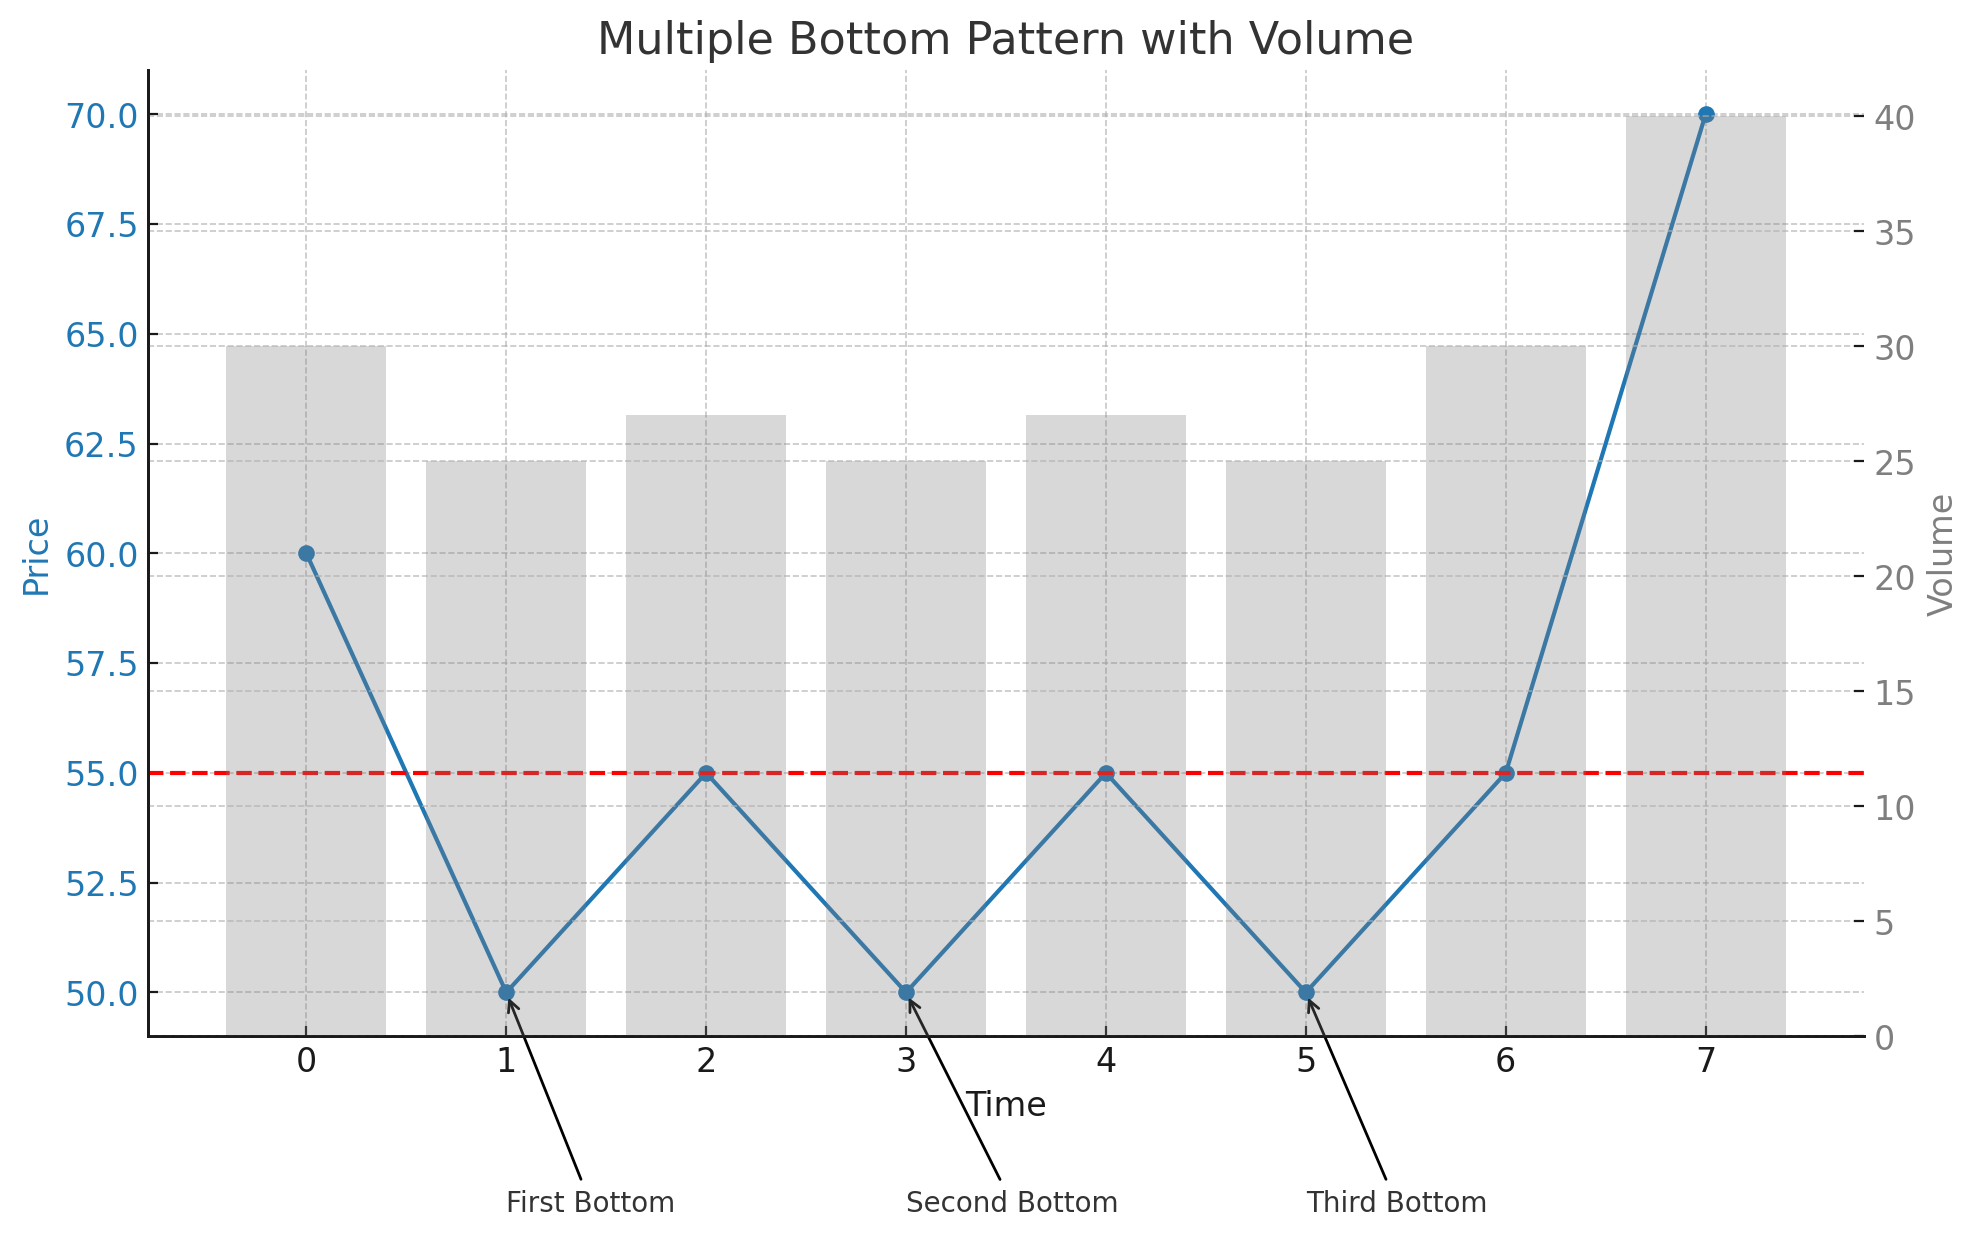
Multiple Bottom Pattern with Volume Analysis
This example highlights the role of volume in confirming the Multiple Bottom pattern. Volume analysis can provide additional confidence in the pattern's validity.
- Initial Decline: The price trend is downward, characterized by decreasing prices and relatively low volume.
- Multiple Bottoms: The price reaches low points with moderate volume as buyers begin to enter the market.
- Rebound to Peaks: The price rises from each bottom, but volume remains moderate.
- Breakout Confirmation: The price breaks above the peaks formed between the bottoms, accompanied by a significant spike in volume, confirming the pattern.
Multiple Bottom Pattern with Volume
Frequently Asked Questions
What is the Multiple Bottom pattern in stock trading?
The Multiple Bottom pattern in stock trading is a bullish reversal pattern that appears at the end of a downtrend. It indicates a potential upward movement and is characterized by the price hitting a low point multiple times before rising again.
How reliable is the Multiple Bottom pattern in stocks?
The Multiple Bottom pattern is considered a reliable bullish reversal signal in stock trading, especially when confirmed by increased trading volume and a strong breakout above the peaks formed between the bottoms. However, it should be used alongside other technical analysis tools.
Can the Multiple Bottom pattern appear in any stock?
Yes, the Multiple Bottom pattern can appear in any stock. It is a widely applicable chart pattern used in technical analysis across various assets, including stocks.
What common mistakes should be avoided when trading the Multiple Bottom pattern?
Common mistakes include entering the trade too early before the breakout confirmation, not confirming the pattern with volume analysis, and failing to set appropriate stop-loss levels to manage risk. By understanding and utilizing the Multiple Bottom pattern, traders can better anticipate bullish reversals and optimize their trading strategies for improved outcomes in the stock market.
What are the key indicators to consider when trading the Multiple Bottom pattern in stocks?
Key indicators include identifying significant support levels, confirming the pattern with increased volume during the breakout, and observing reversal candlestick patterns near the bottoms. These indicators help validate the Multiple Bottom pattern and provide insights for potential significant price movements.