Golden Cross Technical Pattern
Learn about the Golden Cross pattern in stock trading - a bullish reversal pattern that occurs when short-term moving average crosses above long-term moving average. Understand how to identify and trade this technical analysis pattern effectively with volume analysis and key indicators.
Recent Golden Cross Patterns
15 patterns found
NMI HLDGS INC
US
Market Cap: 2.97B
Industry: Insurance - Specialty
Golden Cross
4/14/2026
Bullish pattern with short term moving average (50) closing above the long term m.a. (200), indicating potential upward momentum
QBE INSURANCE GROUP LTD
AU
Market Cap: 24.16B
Industry: Insurance - Property & Casualty
Golden Cross
4/14/2026
Bullish pattern with short term moving average (50) closing above the long term m.a. (200), indicating potential upward momentum
Vaisala Oyj
FI
Market Cap: 1.87B
Industry: Hardware, Equipment & Parts
Golden Cross
4/14/2026
Bullish pattern with short term moving average (50) closing above the long term m.a. (200), indicating potential upward momentum
Zenith Energy Ltd
CA
Market Cap: 31.58M
Industry: Oil & Gas Exploration & Production
Golden Cross
4/14/2026
Bullish pattern with short term moving average (50) closing above the long term m.a. (200), indicating potential upward momentum
GRANITE RIDGE RESOURCES INC
US
Market Cap: 726.75M
Industry: Oil & Gas E&P
Golden Cross
4/13/2026
Bullish pattern with short term moving average (50) closing above the long term m.a. (200), indicating potential upward momentum
PRECISION BIOSCIENCES INC
US
Market Cap: 85.55M
Industry: Biotechnology
Golden Cross
4/13/2026
Bullish pattern with short term moving average (50) closing above the long term m.a. (200), indicating potential upward momentum
ELEDON PHARMACEUTICALS INC
US
Market Cap: 230.06M
Industry: Biotechnology
Golden Cross
4/13/2026
Bullish pattern with short term moving average (50) closing above the long term m.a. (200), indicating potential upward momentum
Carriage Services Inc
US
Market Cap: 706.33M
Industry: Personal Services
Golden Cross
4/13/2026
Bullish pattern with short term moving average (50) closing above the long term m.a. (200), indicating potential upward momentum
Inrom Construction Industries Ltd
IL
Market Cap: 986.96M
Industry: Construction Materials
Golden Cross
4/13/2026
Bullish pattern with short term moving average (50) closing above the long term m.a. (200), indicating potential upward momentum
HITACHI ZOSEN
JP
Market Cap: 1.28B
Industry: Pollution & Treatment Controls
Golden Cross
4/13/2026
Bullish pattern with short term moving average (50) closing above the long term m.a. (200), indicating potential upward momentum
POET TECHS INC.
CA
Market Cap: 566.39M
Industry: Semiconductors
Golden Cross
4/13/2026
Bullish pattern with short term moving average (50) closing above the long term m.a. (200), indicating potential upward momentum
BJS WHSL CLUB HLDGS INC
US
Market Cap: 12.61B
Industry: Discount Stores
Golden Cross
4/13/2026
Bullish pattern with short term moving average (50) closing above the long term m.a. (200), indicating potential upward momentum
NCAB Group
SE
Market Cap: 1.28B
Industry: Hardware, Equipment & Parts
Golden Cross
4/13/2026
Bullish pattern with short term moving average (50) closing above the long term m.a. (200), indicating potential upward momentum
Elspec Engineering Ltd
IL
Market Cap: 3.07B
Industry: Electrical Equipment & Parts
Golden Cross
4/10/2026
Bullish pattern with short term moving average (50) closing above the long term m.a. (200), indicating potential upward momentum
SILVACO GROUP INC
US
Market Cap: 108.77M
Industry: Software - Application
Golden Cross
4/10/2026
Bullish pattern with short term moving average (50) closing above the long term m.a. (200), indicating potential upward momentum
Want to see more technical patterns?
Access our full platform with advanced filtering, real-time alerts, and comprehensive market analysis.
View Full Platform →About Golden Cross Patterns
Golden Cross patterns are technical chart formations that traders and investors use to identify potential entry and exit points. These patterns are based on historical price movements and can help predict future price direction.
Understanding the Golden Cross in Stocks
What is the Golden Cross Pattern in Stocks?
The Golden Cross pattern is a bullish reversal pattern that occurs when a short-term moving average crosses above a long-term moving average. This pattern signifies a potential upward movement in stock prices and is considered a strong signal of a bullish trend. In stock trading, the Golden Cross pattern is significant because it often marks the transition from a bearish phase to a bullish trend. Recognizing this pattern can help traders anticipate price movements and make strategic trades.
How to Identify Golden Cross Patterns
Identifying the Golden Cross pattern involves several key steps:
- Downtrend: Look for a clear downtrend in the stock's price.
- Short-Term Moving Average: The short-term moving average (e.g., 50-day MA) crosses above the long-term moving average (e.g., 200-day MA).
- Confirmation: The crossover should be accompanied by increased trading volume, confirming the pattern.
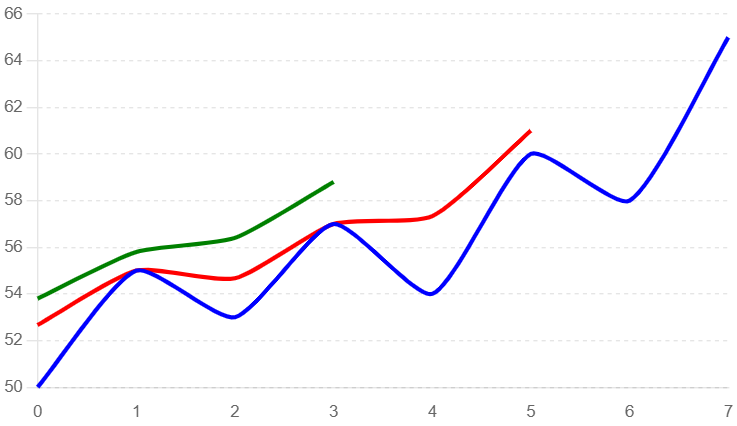
Identifying a Golden Cross Pattern
In this example, we use a typical stock chart to illustrate the formation of a Golden Cross pattern. Key elements to observe include the downtrend, the crossover of moving averages, and the subsequent increase in stock price.
- Downtrend: The price of the stock shows a clear downward trend leading into the pattern.
- Crossover: The short-term moving average crosses above the long-term moving average.
- Breakout Confirmation: The price rises after the crossover, confirming the pattern.
Golden Cross Pattern
Key Indicators
- Moving Averages: The short-term moving average crossing above the long-term moving average.
- Volume Spikes: Increased trading volume often accompanies the crossover, indicating strong buying interest.
- Support Levels: The crossover should occur near significant support levels on the chart.
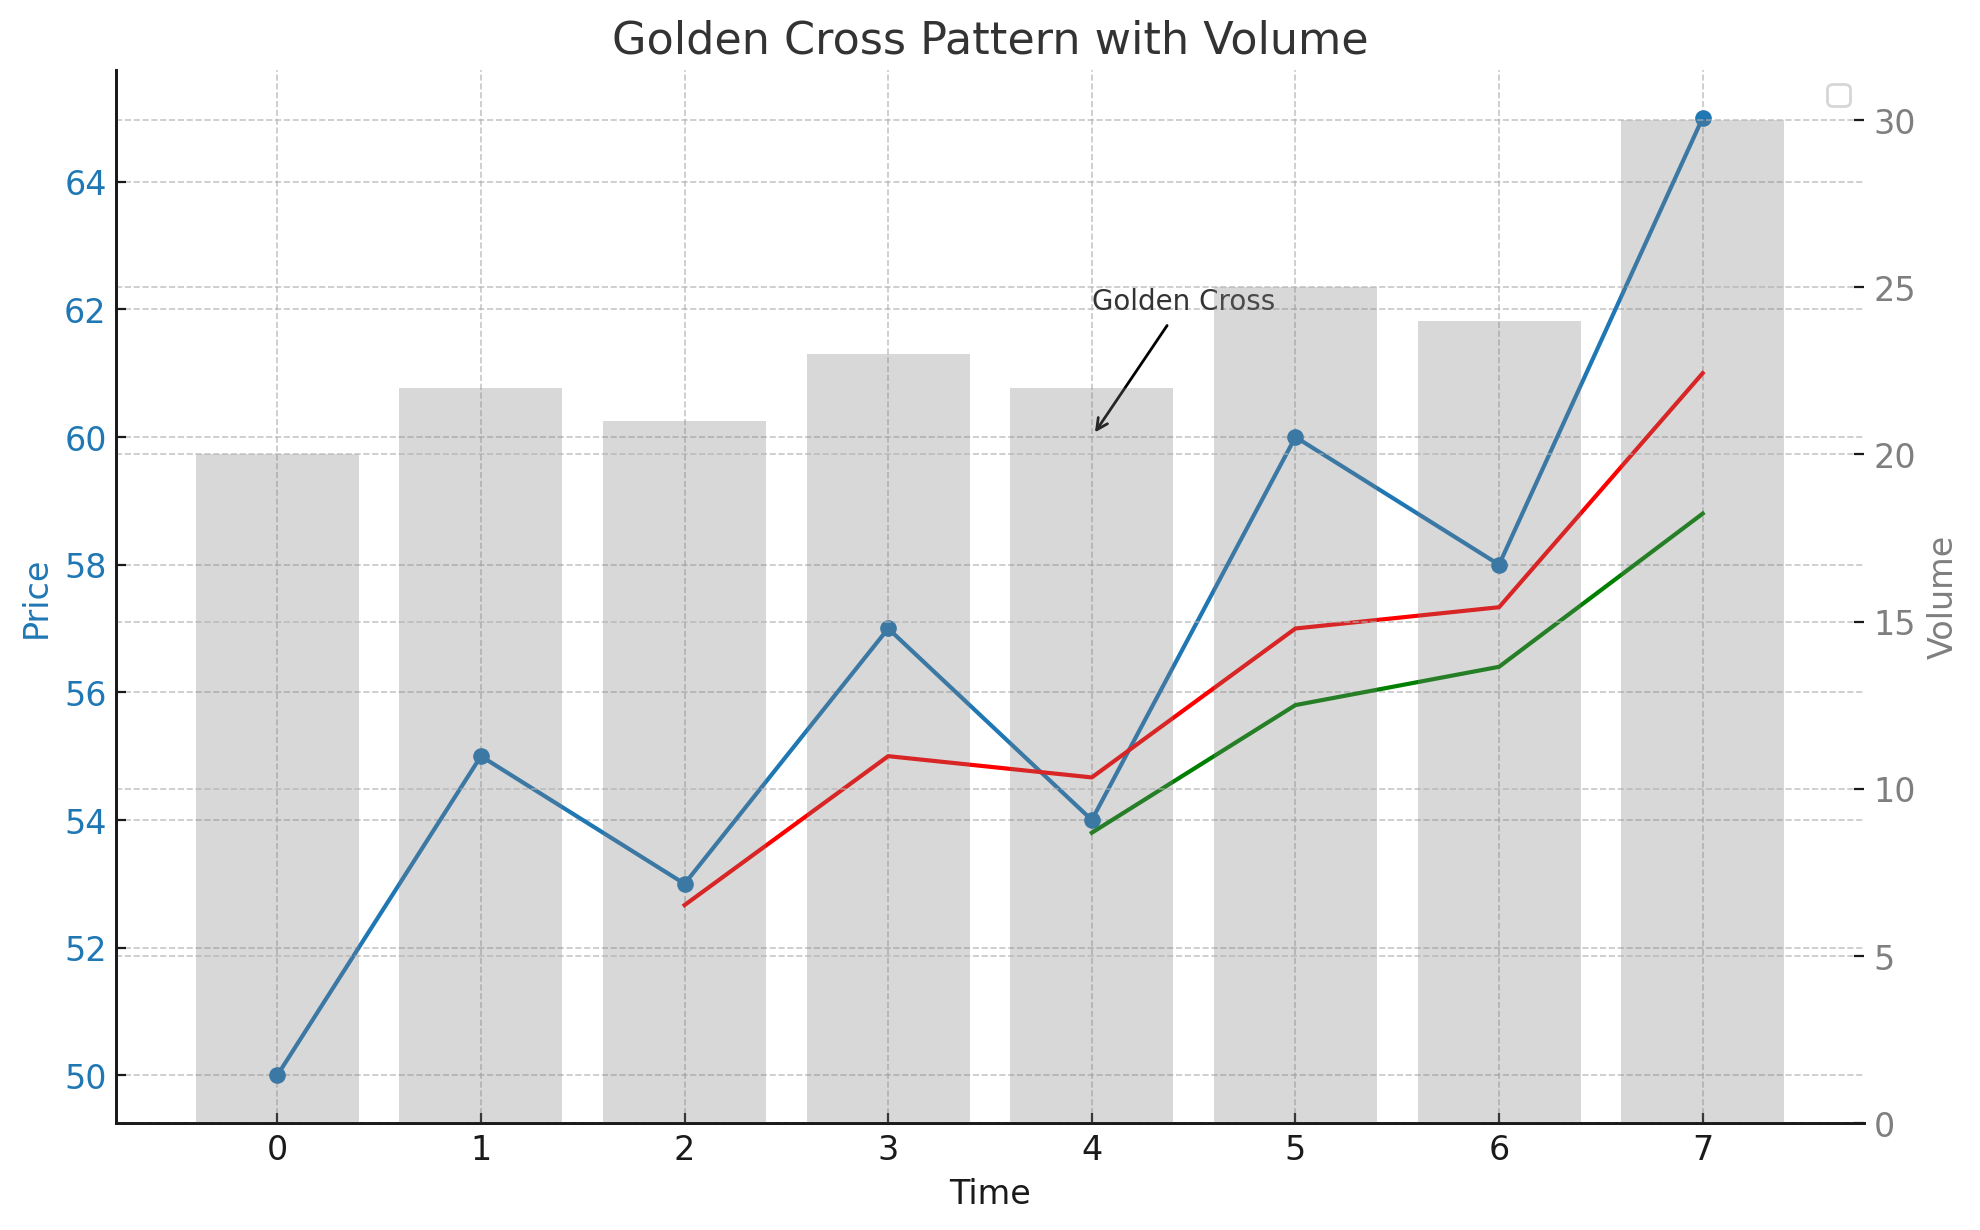
Golden Cross Pattern with Volume Analysis
This example highlights the role of volume in confirming the Golden Cross pattern. Volume analysis can provide additional confidence in the pattern's validity.
- Downtrend: The price trend is downward, characterized by decreasing prices and moderate volume.
- Crossover: The short-term moving average crosses above the long-term moving average with moderate volume.
- Breakout: The price rises after the crossover with a significant spike in volume, confirming the pattern.
Golden Cross Pattern with Volume
Frequently Asked Questions
What is the Golden Cross pattern in stock trading?
The Golden Cross pattern in stock trading is a bullish reversal pattern that occurs when a short-term moving average crosses above a long-term moving average. It signifies a potential upward movement in stock prices and is considered a strong signal of a bullish trend.
How reliable is the Golden Cross pattern in stocks?
The Golden Cross pattern is considered a reliable bullish reversal signal in stock trading, especially when confirmed by increased trading volume and a strong price movement after the crossover. However, it should be used alongside other technical analysis tools.
Can the Golden Cross pattern appear in any stock?
Yes, the Golden Cross pattern can appear in any stock. It is a widely applicable chart pattern used in technical analysis across various assets, including stocks.
What common mistakes should be avoided when trading the Golden Cross pattern?
Common mistakes include entering the trade too early before the crossover confirmation, not confirming the pattern with volume analysis, and failing to set appropriate stop-loss levels to manage risk. By understanding and utilizing the Golden Cross pattern, traders can better anticipate bullish reversals and optimize their trading strategies for improved outcomes in the stock market.
What are the key indicators to consider when trading the Golden Cross pattern in stocks?
Key indicators include the short-term moving average crossing above the long-term moving average, confirming the pattern with increased volume during the crossover, and observing bullish price movements after the crossover. These indicators help validate the Golden Cross pattern and provide insights for potential significant price movements.