Double Top Technical Pattern
Learn about the Double Top pattern in stock trading - a bearish reversal pattern that signals potential downward movement. Understand how to identify and trade this technical analysis pattern effectively with volume analysis and key indicators.
Recent Double Top Patterns
15 patterns found
XCF GLOBAL INC-A
US
Market Cap: 39.37M
Industry: Oil & Gas Exploration & Production
Double Top
4/13/2026
Bearish reversal pattern showing two consecutive peaks at a resistance level, indicating a potential downtrend
WEBTOON ENTMT INC
US
Market Cap: 1.46B
Industry: Software - Application
Double Top
4/13/2026
Bearish reversal pattern showing two consecutive peaks at a resistance level, indicating a potential downtrend
Ascendis Pharma AS
DK
Market Cap: 15.26B
Industry: Biotechnology
Double Top
4/13/2026
Bearish reversal pattern showing two consecutive peaks at a resistance level, indicating a potential downtrend
FIRST CAPITAL INC
US
Market Cap: 179.36M
Industry: Banks - Regional
Double Top
4/13/2026
Bearish reversal pattern showing two consecutive peaks at a resistance level, indicating a potential downtrend
GlobalData Plc
GB
Market Cap: 793.84M
Industry: Consulting Services
Double Top
4/13/2026
Bearish reversal pattern showing two consecutive peaks at a resistance level, indicating a potential downtrend
HUNTSMAN CORP
US
Market Cap: 2.19B
Industry: Other
Double Top
4/13/2026
Bearish reversal pattern showing two consecutive peaks at a resistance level, indicating a potential downtrend
Petronor E&P Ltd
NO
Market Cap: 18.98M
Industry: Oil & Gas E&P
Double Top
4/13/2026
Bearish reversal pattern showing two consecutive peaks at a resistance level, indicating a potential downtrend
Ideaya Biosciences Inc
US
Market Cap: 2.91B
Industry: Biotechnology
Double Top
4/13/2026
Bearish reversal pattern showing two consecutive peaks at a resistance level, indicating a potential downtrend
PERMA-PIPE INTL HLDGS INC
US
Market Cap: 274.41M
Industry: Construction
Double Top
4/13/2026
Bearish reversal pattern showing two consecutive peaks at a resistance level, indicating a potential downtrend
CALERES INC
US
Market Cap: 420.78M
Industry: Apparel Retail
Double Top
4/13/2026
Bearish reversal pattern showing two consecutive peaks at a resistance level, indicating a potential downtrend
Mostostal Zabrze S.A.
PL
Market Cap: 132.02M
Industry: Engineering & Construction
Double Top
4/13/2026
Bearish reversal pattern showing two consecutive peaks at a resistance level, indicating a potential downtrend
DORCHESTER MINERALS LP
US
Market Cap: 1.35B
Industry: Oil & Gas Exploration & Production
Double Top
4/13/2026
Bearish reversal pattern showing two consecutive peaks at a resistance level, indicating a potential downtrend
STOCK YARDS BANCORP INC
US
Market Cap: 2.04B
Industry: Banks - Regional
Double Top
4/13/2026
Bearish reversal pattern showing two consecutive peaks at a resistance level, indicating a potential downtrend
5N Plus Inc
CA
Market Cap: 2.29B
Industry: Chemicals - Specialty
Double Top
4/13/2026
Bearish reversal pattern showing two consecutive peaks at a resistance level, indicating a potential downtrend
OP Bancorp
US
Market Cap: 212.55M
Industry: Banks - Regional
Double Top
4/13/2026
Bearish reversal pattern showing two consecutive peaks at a resistance level, indicating a potential downtrend
Want to see more technical patterns?
Access our full platform with advanced filtering, real-time alerts, and comprehensive market analysis.
View Full Platform →About Double Top Patterns
Double Top patterns are technical chart formations that traders and investors use to identify potential entry and exit points. These patterns are based on historical price movements and can help predict future price direction.
Understanding the Double Top in Stocks
What is the Double Top Pattern in Stocks?
The Double Top pattern is a bearish reversal pattern that appears at the end of an uptrend, indicating a potential downward movement. This pattern forms when the price of a stock hits a high twice, with a moderate low in between, resembling the letter "M" on a price chart. In stock trading, the Double Top pattern is significant because it often marks the end of a bullish phase and the beginning of a bearish trend. Recognizing this pattern can help traders anticipate price movements and make strategic trades.
How to Identify Double Top Patterns
Identifying the Double Top pattern involves several key steps:
- Initial Uptrend: Look for a clear uptrend where the price reaches new highs.
- First Top: The price hits a high point and then declines to form a moderate low.
- Second Top: The price rises again, hitting a similar high point as the first top.
- Breakout: The price declines and breaks below the moderate low, confirming the pattern.
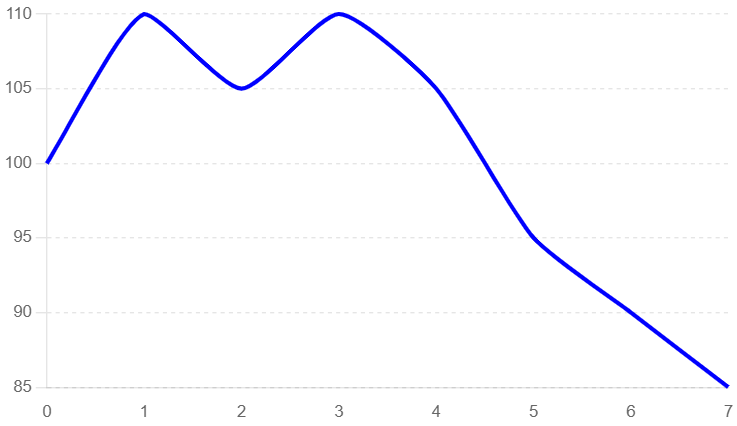
Identifying a Double Top Pattern
In this example, we use a typical candlestick chart to illustrate the formation of a Double Top pattern. Key elements to observe include the initial uptrend, the formation of the first and second tops, and the subsequent breakout.
- Initial Uptrend: The price of the stock shows a clear uptrend, indicating bullish market sentiment.
- First Top: The price hits a high point and then declines to form a moderate low.
- Second Top: The price rises again, hitting a similar high point as the first top.
- Breakout Confirmation: The price declines and breaks below the moderate low, confirming the pattern.
Double Top Pattern
Key Indicators
- Candlestick Patterns: Look for reversal candlestick patterns near the tops.
- Volume Spikes: Increased trading volume often accompanies the breakout, indicating strong selling interest.
- Resistance Levels: The tops should align with significant resistance levels on the chart.
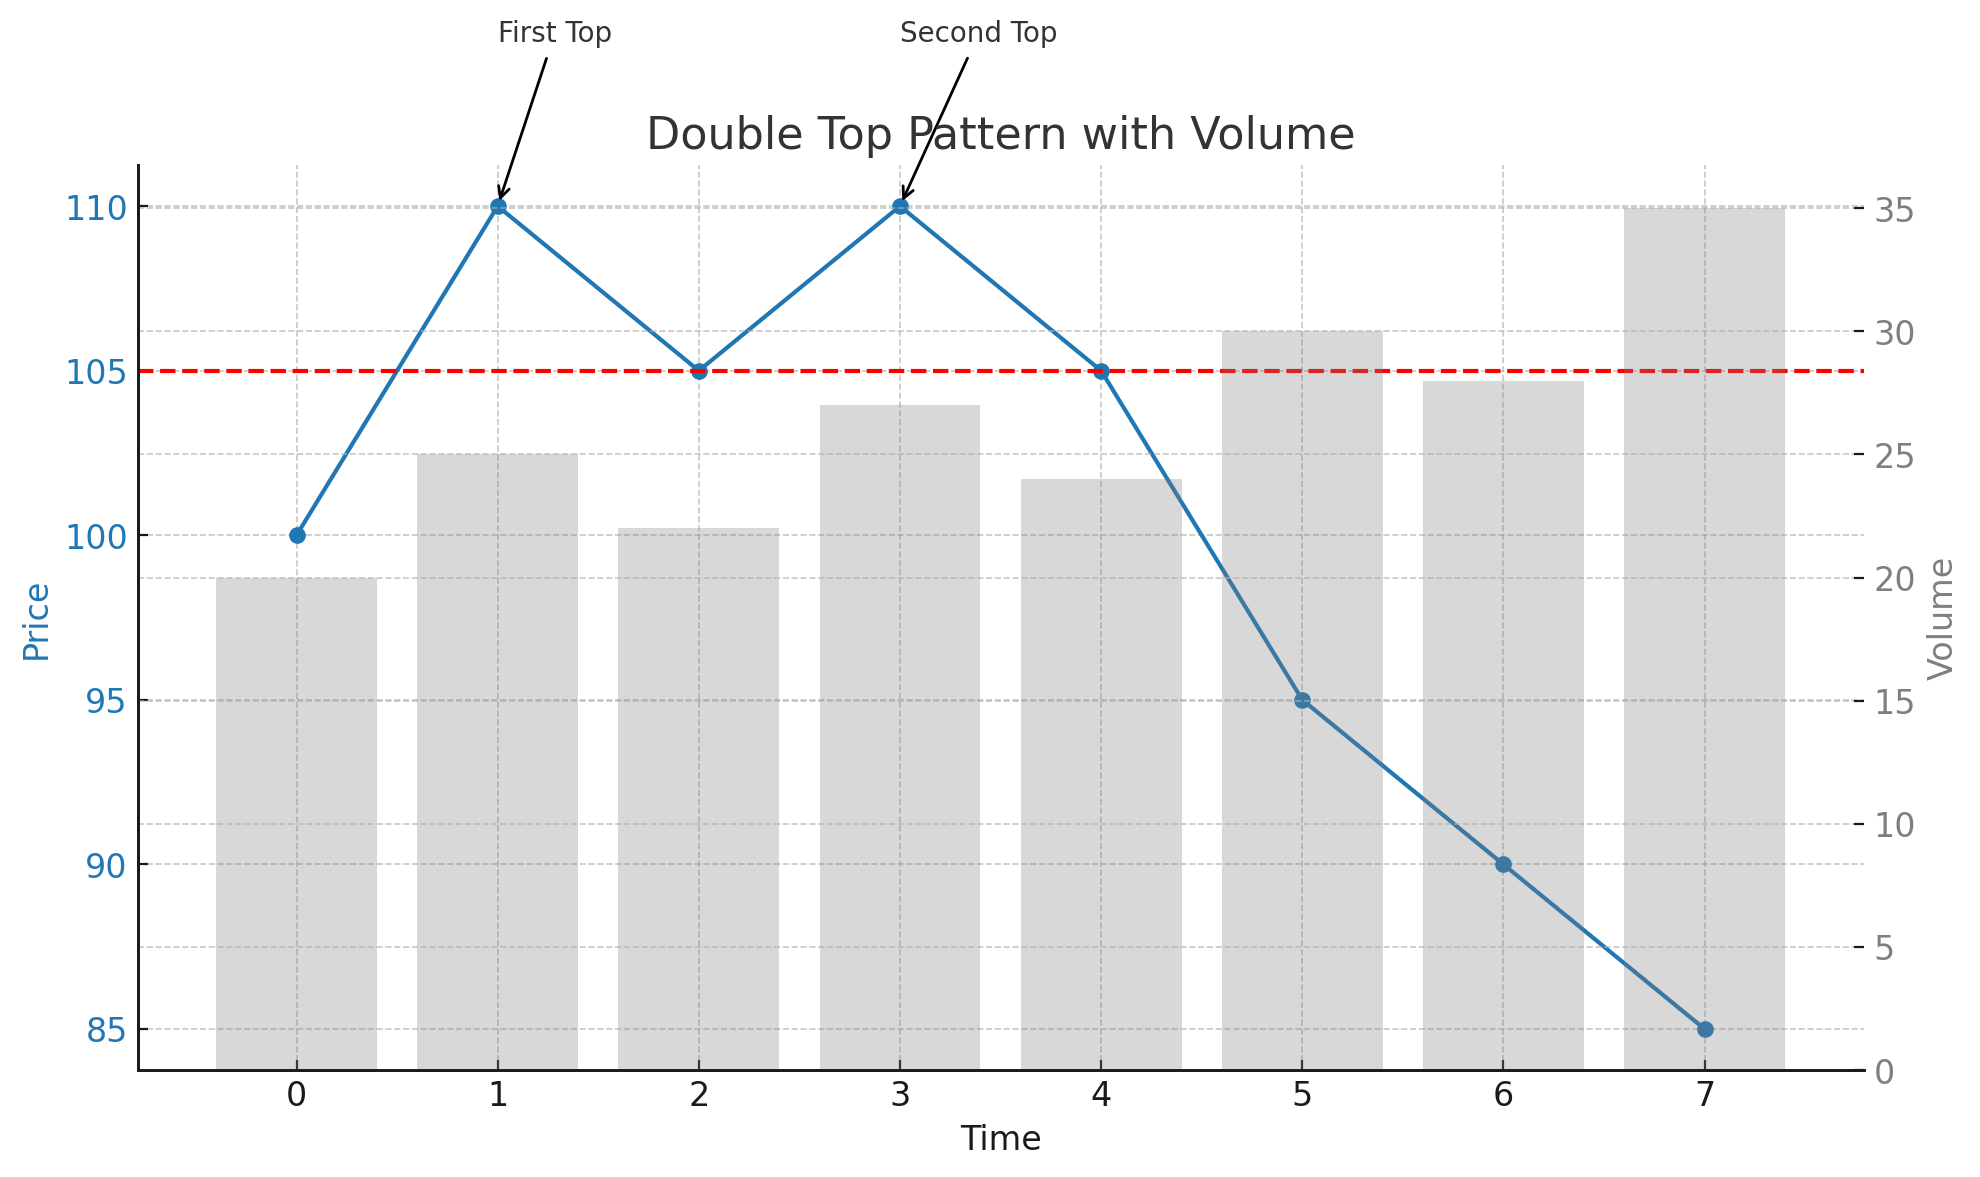
Double Top Pattern with Volume Analysis
This example highlights the role of volume in confirming the Double Top pattern. Volume analysis can provide additional confidence in the pattern's validity.
- Initial Uptrend: The price trend is upward, characterized by increasing prices and moderate volume.
- First Top: The price hits a high point with moderate volume as sellers begin to enter the market.
- Second Top: The price rises again, hitting a similar high point as the first top with moderate volume.
- Breakout: The price declines and breaks below the moderate low with a significant spike in volume, confirming the pattern.
Double Top Pattern with Volume
Frequently Asked Questions
What is the Double Top pattern in stock trading?
The Double Top pattern in stock trading is a bearish reversal pattern that appears at the end of an uptrend. It indicates a potential downward movement and is characterized by the price hitting a high point twice with a moderate low in between, resembling the letter "M."
How reliable is the Double Top pattern in stocks?
The Double Top pattern is considered a reliable bearish reversal signal in stock trading, especially when confirmed by increased trading volume and a strong breakout below the moderate low. However, it should be used alongside other technical analysis tools.
Can the Double Top pattern appear in any stock?
Yes, the Double Top pattern can appear in any stock. It is a widely applicable chart pattern used in technical analysis across various assets, including stocks.
What common mistakes should be avoided when trading the Double Top pattern?
Common mistakes include entering the trade too early before the breakout confirmation, not confirming the pattern with volume analysis, and failing to set appropriate stop-loss levels to manage risk. By understanding and utilizing the Double Top pattern, traders can better anticipate bearish reversals and optimize their trading strategies for improved outcomes in the stock market.
What are the key indicators to consider when trading the Double Top pattern in stocks?
Key indicators include identifying significant resistance levels, confirming the pattern with increased volume during the breakout, and observing reversal candlestick patterns near the tops. These indicators help validate the Double Top pattern and provide insights for potential significant price movements.