Double Bottom Technical Pattern
Learn about the Double Bottom pattern in stock trading - a bullish reversal pattern that signals potential upward movement. Understand how to identify and trade this technical analysis pattern effectively with volume analysis and key indicators.
Recent Double Bottom Patterns
15 patterns found
BRSL
GB
Market Cap: 2.51B
Industry: Gambling
Double Bottom
4/13/2026
Bullish reversal pattern showing two consecutive troughs at a support level, suggesting a potential uptrend
Adocia S.A.
FR
Market Cap: 85.22M
Industry: Biotechnology
Double Bottom
4/13/2026
Bullish reversal pattern showing two consecutive troughs at a support level, suggesting a potential uptrend
Sunflower Sustainable Investments Ltd
IL
Market Cap: 133.27M
Industry: Renewable Utilities
Double Bottom
4/13/2026
Bullish reversal pattern showing two consecutive troughs at a support level, suggesting a potential uptrend
ELBIT IMAGING LTD
IL
Market Cap: 17.54M
Industry: Medical - Devices
Double Bottom
4/13/2026
Bullish reversal pattern showing two consecutive troughs at a support level, suggesting a potential uptrend
SEALSQ CORP
CH
Market Cap: 288.96M
Industry: Semiconductors
Double Bottom
4/13/2026
Bullish reversal pattern showing two consecutive troughs at a support level, suggesting a potential uptrend
4iG Nyrt.
HU
Market Cap: 3.87B
Industry: Telecom Services
Double Bottom
4/13/2026
Bullish reversal pattern showing two consecutive troughs at a support level, suggesting a potential uptrend
Marqeta Inc
US
Market Cap: 1.86B
Industry: Software - Infrastructure
Double Bottom
4/13/2026
Bullish reversal pattern showing two consecutive troughs at a support level, suggesting a potential uptrend
TRUPANION INC
US
Market Cap: 1.12B
Industry: Insurance - Diversified
Double Bottom
4/13/2026
Bullish reversal pattern showing two consecutive troughs at a support level, suggesting a potential uptrend
OPTIMIZERx Corp
US
Market Cap: 114.93M
Industry: Medical - Healthcare Information Services
Double Bottom
4/13/2026
Bullish reversal pattern showing two consecutive troughs at a support level, suggesting a potential uptrend
PEXA Group Ltd
AU
Market Cap: 1.84B
Industry: Real Estate - Services
Double Bottom
4/13/2026
Bullish reversal pattern showing two consecutive troughs at a support level, suggesting a potential uptrend
OMNIAB INC
US
Market Cap: 186.57M
Industry: Biotechnology
Double Bottom
4/13/2026
Bullish reversal pattern showing two consecutive troughs at a support level, suggesting a potential uptrend
Quirin Privatbank AG
DE
Market Cap: 170.40M
Industry: Other
Double Bottom
4/13/2026
Bullish reversal pattern showing two consecutive troughs at a support level, suggesting a potential uptrend
Hansen Technologies Ltd
AU
Market Cap: 748.47M
Industry: Software - Application
Double Bottom
4/13/2026
Bullish reversal pattern showing two consecutive troughs at a support level, suggesting a potential uptrend
ARB Corporation Ltd
AU
Market Cap: 1.21B
Industry: Auto - Parts
Double Bottom
4/13/2026
Bullish reversal pattern showing two consecutive troughs at a support level, suggesting a potential uptrend
AECOM
US
Market Cap: 11.26B
Industry: Engineering & Construction
Double Bottom
4/13/2026
Bullish reversal pattern showing two consecutive troughs at a support level, suggesting a potential uptrend
Want to see more technical patterns?
Access our full platform with advanced filtering, real-time alerts, and comprehensive market analysis.
View Full Platform →About Double Bottom Patterns
Double Bottom patterns are technical chart formations that traders and investors use to identify potential entry and exit points. These patterns are based on historical price movements and can help predict future price direction.
Understanding the Double Bottom in Stocks
What is the Double Bottom Pattern in Stocks?
The Double Bottom pattern is a bullish reversal pattern that appears at the end of a downtrend, indicating a potential upward movement. This pattern forms when the price of a stock hits a low twice, with a moderate high in between, resembling the letter "W" on a price chart. In stock trading, the Double Bottom pattern is significant because it often marks the end of a bearish phase and the beginning of a bullish trend. Recognizing this pattern can help traders anticipate price movements and make strategic trades.
How to Identify Double Bottom Patterns
Identifying the Double Bottom pattern involves several key steps:
- Initial Decline: Look for a clear downtrend where the price reaches new lows.
- First Bottom: The price hits a low point and then rebounds to form a moderate peak.
- Second Bottom: The price declines again, hitting a similar low point as the first bottom.
- Breakout: The price rises and breaks above the moderate peak, confirming the pattern.
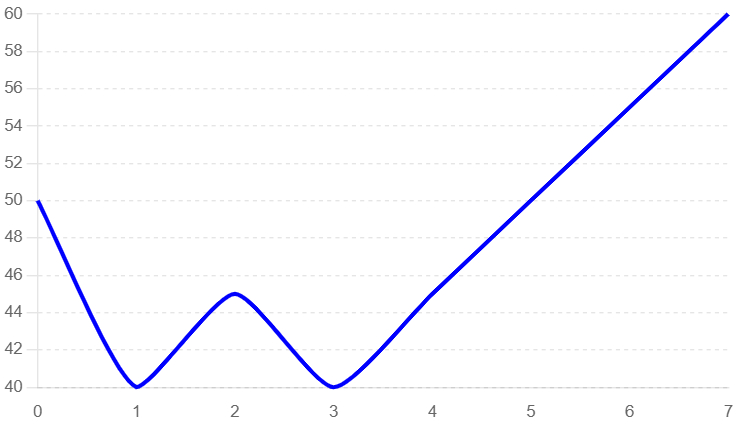
Identifying a Double Bottom Pattern
In this example, we use a typical candlestick chart to illustrate the formation of a Double Bottom pattern. Key elements to observe include the initial decline, the formation of the first and second bottoms, and the subsequent breakout.
- Initial Decline: The price of the stock shows a clear downtrend, indicating bearish market sentiment.
- First Bottom: The price hits a low point and then rebounds to form a moderate peak.
- Second Bottom: The price declines again, hitting a similar low point as the first bottom.
- Breakout Confirmation: The price rises and breaks above the moderate peak, confirming the pattern.
Double Bottom Pattern
Key Indicators
- Candlestick Patterns: Look for reversal candlestick patterns near the bottoms.
- Volume Spikes: Increased trading volume often accompanies the breakout, indicating strong buying interest.
- Support Levels: The bottoms should align with significant support levels on the chart.
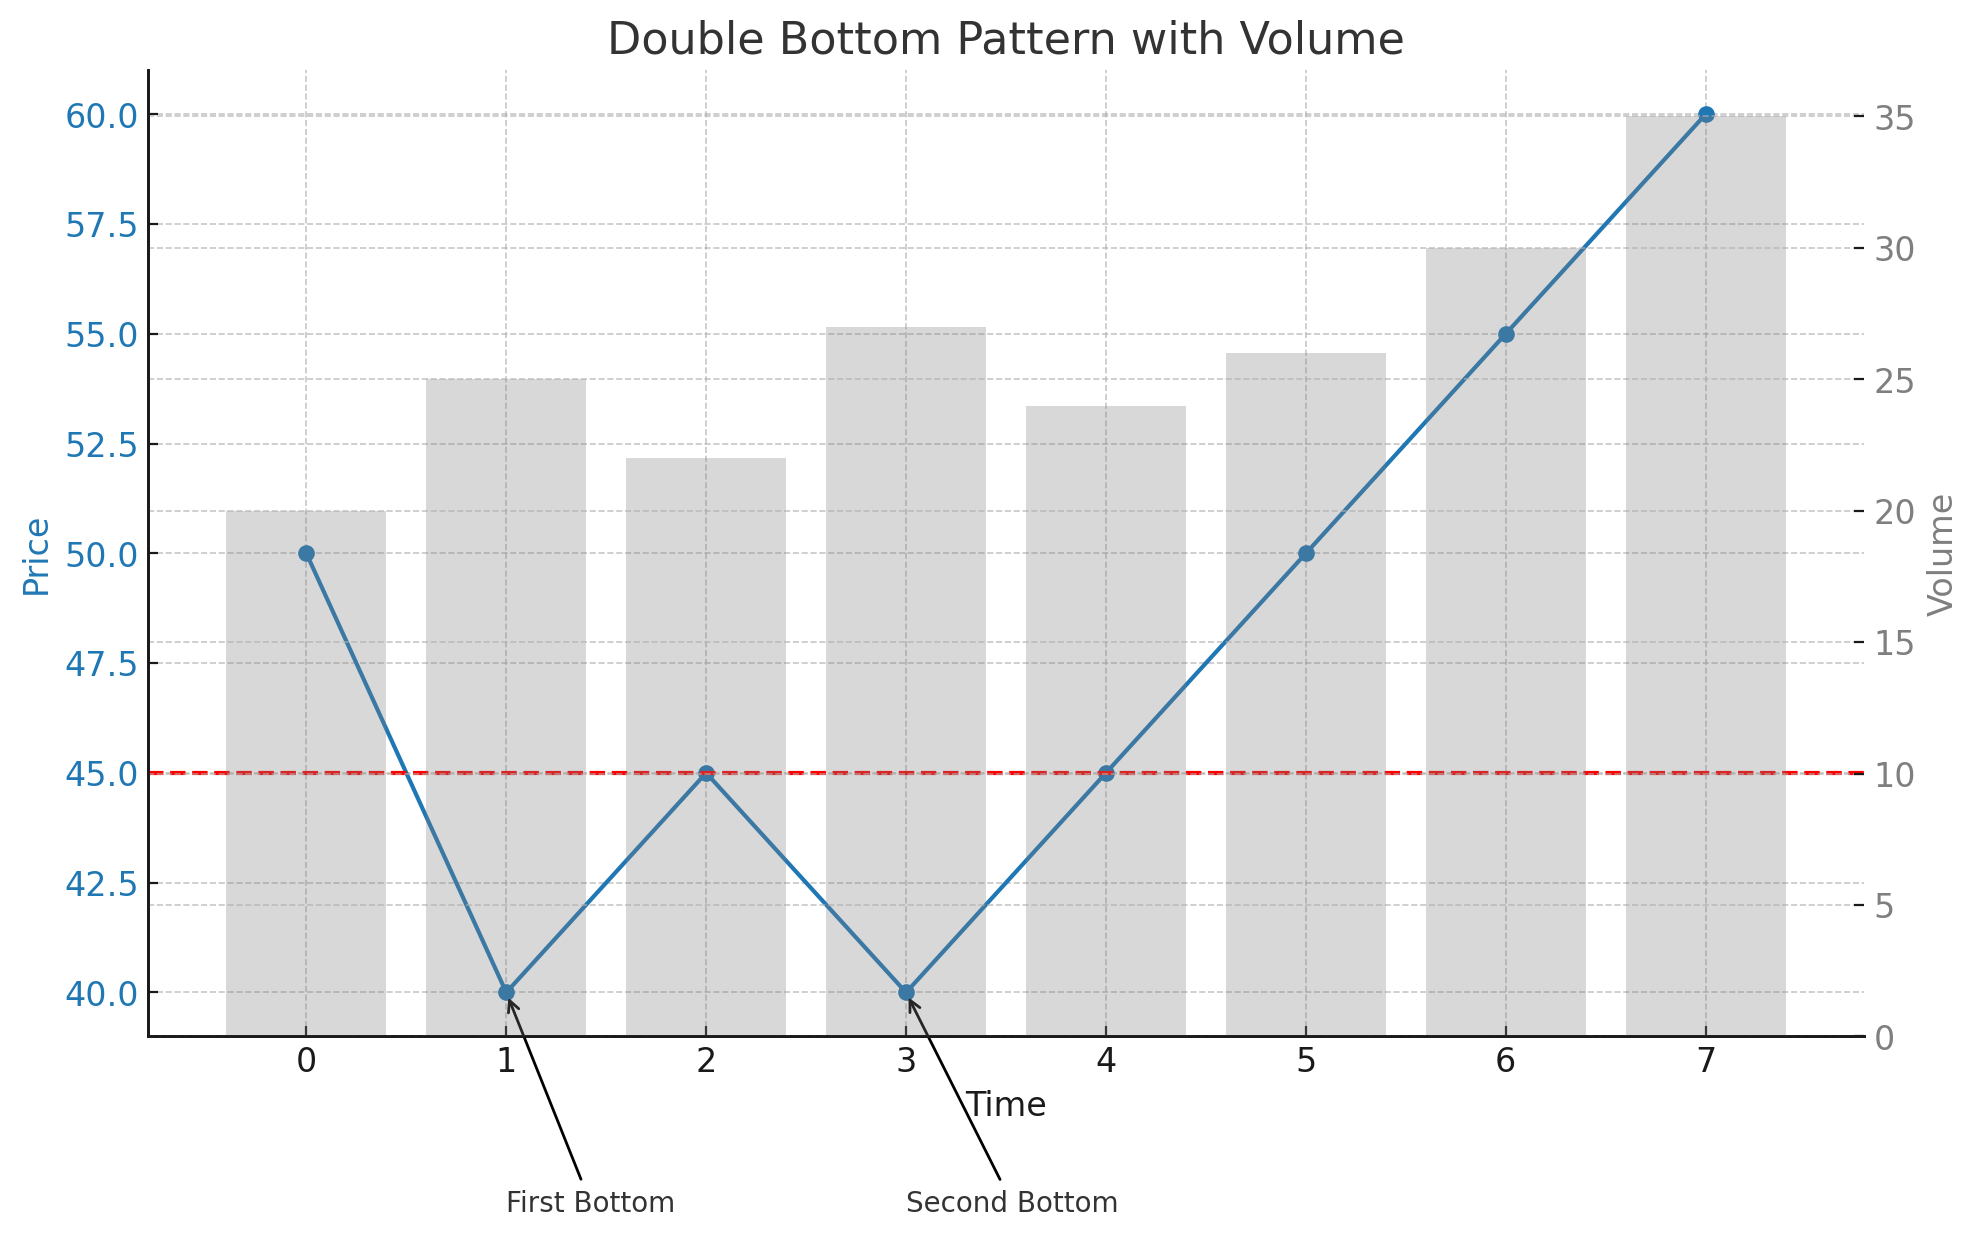
Double Bottom Pattern with Volume Analysis
This example highlights the role of volume in confirming the Double Bottom pattern. Volume analysis can provide additional confidence in the pattern's validity.
- Initial Decline: The price trend is downward, characterized by decreasing prices and relatively low volume.
- First Bottom: The price hits a low point with moderate volume as buyers begin to enter the market.
- Second Bottom: The price declines again, hitting a similar low point as the first bottom with moderate volume.
- Breakout: The price rises and breaks above the moderate peak with a significant spike in volume, confirming the pattern.
Double Bottom Pattern with Volume
Frequently Asked Questions
What is the Double Bottom pattern in stock trading?
The Double Bottom pattern in stock trading is a bullish reversal pattern that appears at the end of a downtrend. It indicates a potential upward movement and is characterized by the price hitting a low point twice with a moderate peak in between, resembling the letter "W."
How reliable is the Double Bottom pattern in stocks?
The Double Bottom pattern is considered a reliable bullish reversal signal in stock trading, especially when confirmed by increased trading volume and a strong breakout above the moderate peak. However, it should be used alongside other technical analysis tools.
Can the Double Bottom pattern appear in any stock?
Yes, the Double Bottom pattern can appear in any stock. It is a widely applicable chart pattern used in technical analysis across various assets, including stocks.
What common mistakes should be avoided when trading the Double Bottom pattern?
Common mistakes include entering the trade too early before the breakout confirmation, not confirming the pattern with volume analysis, and failing to set appropriate stop-loss levels to manage risk. By understanding and utilizing the Double Bottom pattern, traders can better anticipate bullish reversals and optimize their trading strategies for improved outcomes in the stock market.
What are the key indicators to consider when trading the Double Bottom pattern in stocks?
Key indicators include identifying significant support levels, confirming the pattern with increased volume during the breakout, and observing reversal candlestick patterns near the bottoms. These indicators help validate the Double Bottom pattern and provide insights for potential significant price movements.