Bullish BreakOut Technical Pattern
Learn about the Breakout pattern in stock trading - a technical analysis signal that occurs when price moves outside defined support or resistance levels. Understand how to identify and trade this pattern effectively with volume analysis and key indicators.
Recent Bullish BreakOut Patterns
15 patterns found
Liberty Global plc
GB
Market Cap: 4.55B
Industry: Telecom Services
Bullish BreakOut
2/18/2026
Bullish pattern with a breakout above a resistance level, indicating potential upward momentum
Lokum Deweloper S.A.
PL
Market Cap: 127.43M
Industry: Real Estate - Development
Bullish BreakOut
1/20/2026
Bullish pattern with a breakout above a resistance level, indicating potential upward momentum
Ocugen Inc
US
Market Cap: 527.82M
Industry: Biotechnologie
Bullish BreakOut
1/13/2026
Bullish pattern with a breakout above a resistance level, indicating potential upward momentum
Sofwave Medical Ltd
IL
Market Cap: 382.42M
Industry: Medical Devices
Bullish BreakOut
1/12/2026
Bullish pattern with a breakout above a resistance level, indicating potential upward momentum
TomTom NV
NL
Market Cap: 999.61M
Bullish BreakOut
1/8/2026
Bullish pattern with a breakout above a resistance level, indicating potential upward momentum
SSAB AB
SE
Market Cap: 8.15B
Bullish BreakOut
1/2/2026
Bullish pattern with a breakout above a resistance level, indicating potential upward momentum
Zimplats Holdings Ltd
GG
Market Cap: 1.29B
Industry: Other Precious Metals & Mining
Bullish BreakOut
12/22/2025
Bullish pattern with a breakout above a resistance level, indicating potential upward momentum
PLASTIQ.V.LOI.INH.EO -90
FR
Market Cap: 44.37M
Industry: Auto Parts
Bullish BreakOut
12/19/2025
Bullish pattern with a breakout above a resistance level, indicating potential upward momentum
Ora Banda Mining Ltd
AU
Market Cap: 1.97B
Industry: Gold
Bullish BreakOut
12/18/2025
Bullish pattern with a breakout above a resistance level, indicating potential upward momentum
JSC Halyk bank
KZ
Market Cap: 7.58B
Industry: Banks - Regional
Bullish BreakOut
12/12/2025
Bullish pattern with a breakout above a resistance level, indicating potential upward momentum
9F Inc
CN
Market Cap: 86.77M
Industry: Information Technology Services
Bullish BreakOut
12/10/2025
Bullish pattern with a breakout above a resistance level, indicating potential upward momentum
Plby Group Inc
US
Market Cap: 211.20M
Industry: Leisure
Bullish BreakOut
12/8/2025
Bullish pattern with a breakout above a resistance level, indicating potential upward momentum
Base Carbon Inc
CA
Market Cap: 72.52M
Industry: Asset Management
Bullish BreakOut
12/1/2025
Bullish pattern with a breakout above a resistance level, indicating potential upward momentum
EcoGraf Ltd
AU
Market Cap: 168.37M
Industry: Other Industrial Metals & Mining
Bullish BreakOut
10/10/2025
Bullish pattern with a breakout above a resistance level, indicating potential upward momentum
James Fisher and Sons plc
GB
Market Cap: 271.04M
Industry: Marine Shipping
Bullish BreakOut
10/9/2025
Bullish pattern with a breakout above a resistance level, indicating potential upward momentum
Want to see more technical patterns?
Access our full platform with advanced filtering, real-time alerts, and comprehensive market analysis.
View Full Platform →About Bullish BreakOut Patterns
Bullish BreakOut patterns are technical chart formations that traders and investors use to identify potential entry and exit points. These patterns are based on historical price movements and can help predict future price direction.
Understanding the Breakout Pattern in Stocks
What is the Breakout Pattern in Stocks?
The Breakout pattern is a technical analysis signal that occurs when the price of a stock moves outside a defined support or resistance level with increased volume. This pattern indicates a potential continuation of the current trend or a reversal, leading to significant price movements. In stock trading, the Breakout pattern is significant because it often marks the beginning of a new trend. Recognizing this pattern can help traders anticipate price movements and make strategic trades.
How to Identify Breakout Patterns
Identifying the Breakout pattern involves several key steps:
- Trendlines: Identify the support and resistance levels on the price chart.
- Consolidation: Observe the price consolidating within the support and resistance levels.
- Breakout: The price breaks above the resistance level (for a bullish breakout) or below the support level (for a bearish breakout), confirming the pattern.
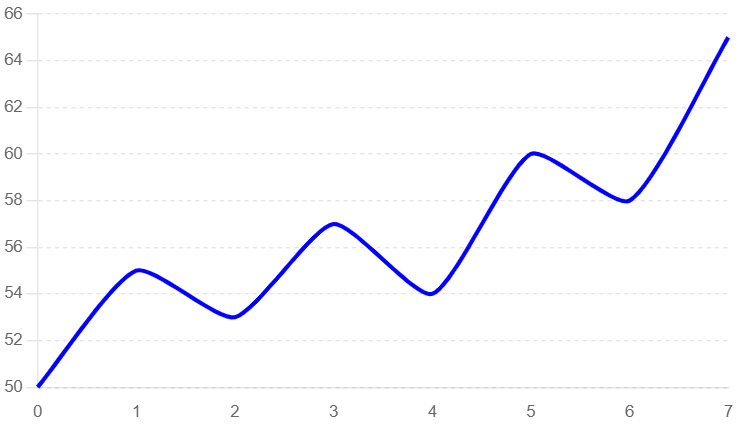
Identifying a Breakout Pattern
In this example, we use a typical candlestick chart to illustrate the formation of a Breakout pattern. Key elements to observe include the trendlines, the consolidation phase, and the subsequent breakout.
- Trendlines: The price of the stock shows defined support and resistance levels.
- Consolidation: The price consolidates within these levels, indicating market indecision.
- Breakout Confirmation: The price breaks above the resistance level, confirming a bullish breakout.
Breakout Pattern
Key Indicators
- Volume Spikes: Increased trading volume often accompanies the breakout, indicating strong interest.
- Price Action: Observe the price action following the breakout for confirmation of the trend.
- Candlestick Patterns: Look for bullish or bearish candlestick patterns near the breakout point.
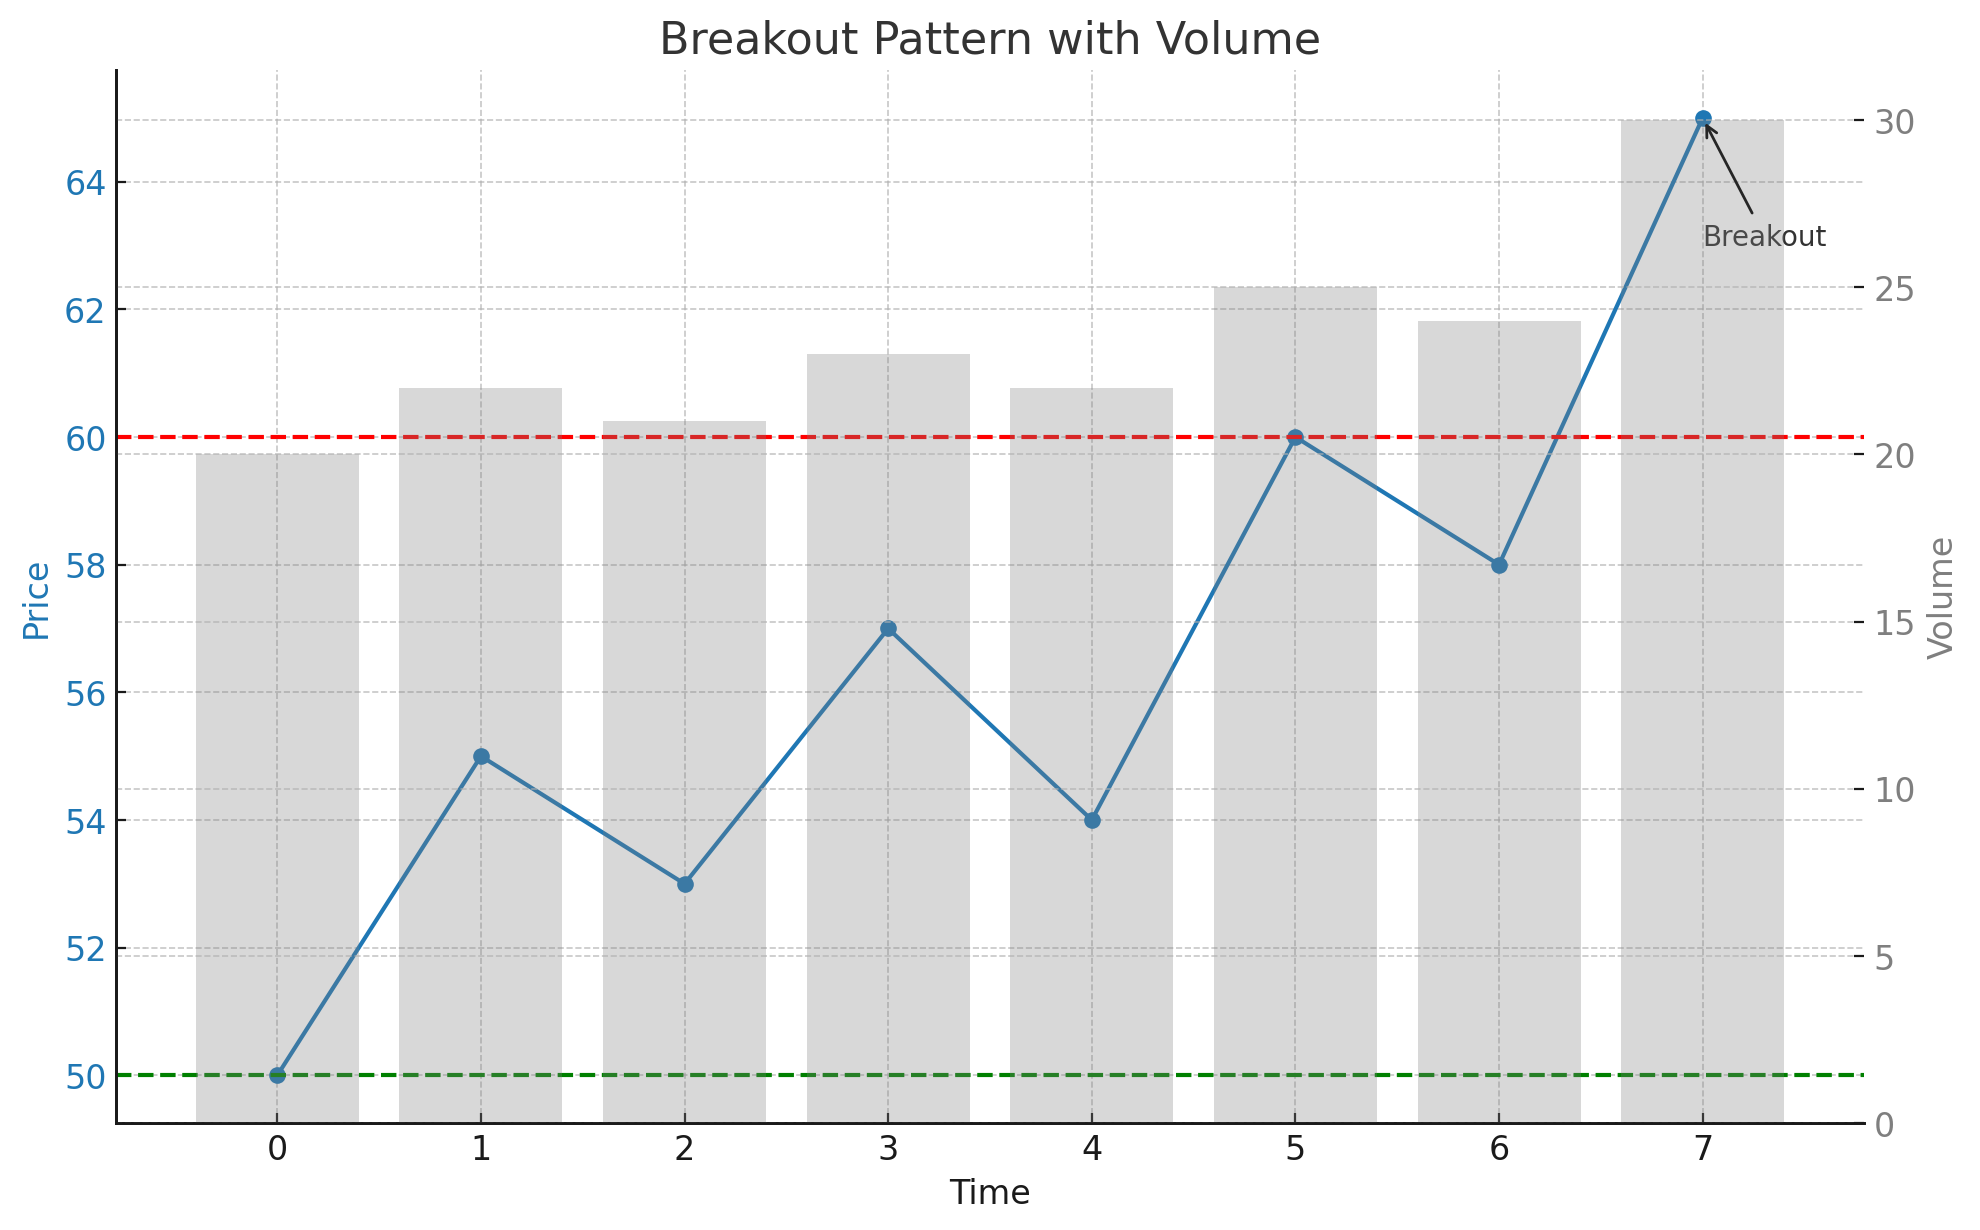
Breakout Pattern with Volume Analysis
This example highlights the role of volume in confirming the Breakout pattern. Volume analysis can provide additional confidence in the pattern's validity.
- Trendlines: Identify the support and resistance levels.
- Consolidation: The price consolidates with moderate volume.
- Breakout: The price breaks above the resistance level with a significant spike in volume, confirming the pattern.
Breakout Pattern with Volume
Frequently Asked Questions
What is the Breakout pattern in stock trading?
The Breakout pattern in stock trading is a technical analysis signal that occurs when the price of a stock moves outside a defined support or resistance level with increased volume. This pattern indicates a potential continuation of the current trend or a reversal, leading to significant price movements.
How reliable is the Breakout pattern in stocks?
The Breakout pattern is considered a reliable signal in stock trading, especially when confirmed by increased trading volume and a strong price movement following the breakout. However, it should be used alongside other technical analysis tools.
Can the Breakout pattern appear in any stock?
Yes, the Breakout pattern can appear in any stock. It is a widely applicable chart pattern used in technical analysis across various assets, including stocks.
What common mistakes should be avoided when trading the Breakout pattern?
Common mistakes include entering the trade too early before the breakout confirmation, not confirming the pattern with volume analysis, and failing to set appropriate stop-loss levels to manage risk. By understanding and utilizing the Breakout pattern, traders can better anticipate significant price movements and optimize their trading strategies for improved outcomes in the stock market.
What are the key indicators to consider when trading the Breakout pattern in stocks?
Key indicators include identifying significant support and resistance levels, confirming the pattern with increased volume during the breakout, and observing bullish or bearish candlestick patterns near the breakout point. These indicators help validate the Breakout pattern and provide insights for potential significant price movements.