Ascending Triangle BreakOut Technical Pattern
Learn about the Triangle Bullish Breakout pattern in stock trading - a continuation pattern that signals potential upward movement. Understand how to identify and trade this technical analysis pattern effectively with volume analysis and key indicators.
Recent Ascending Triangle BreakOut Patterns
15 patterns found
Obrascón Huarte Lain S.A
ES
Market Cap: 253.21M
Industry: Engineering & Construction
Ascending Triangle BreakOut
4/9/2026
Bullish pattern with converging upward trendlines, often leading to an upward breakout
ALPHA & OMEGA SEMICONDUCTOR LTD
US
Ascending Triangle BreakOut
4/8/2026
Bullish pattern with converging upward trendlines, often leading to an upward breakout
BIOMEA FUSION INC
US
Market Cap: 137.37M
Industry: Biotechnology
Ascending Triangle BreakOut
4/7/2026
Bullish pattern with converging upward trendlines, often leading to an upward breakout
Ovid Therapeutics Inc
US
Market Cap: 147.20M
Industry: Biotechnology
Ascending Triangle BreakOut
3/6/2026
Bullish pattern with converging upward trendlines, often leading to an upward breakout
Ramsay Health Care Ltd
AU
Market Cap: 7.05B
Industry: Medical Care Facilities
Ascending Triangle BreakOut
2/26/2026
Bullish pattern with converging upward trendlines, often leading to an upward breakout
ENERGY S.P.A.
IT
Market Cap: 6.58B
Industry: Utilities - Diversified
Ascending Triangle BreakOut
2/17/2026
Bullish pattern with converging upward trendlines, often leading to an upward breakout
Tekla Healthcare Investors
US
Market Cap: 1.11B
Industry: Asset Management
Ascending Triangle BreakOut
2/17/2026
Bullish pattern with converging upward trendlines, often leading to an upward breakout
Worley Ltd
AU
Market Cap: 2.52B
Industry: Oil & Gas Equipment & Services
Ascending Triangle BreakOut
2/11/2026
Bullish pattern with converging upward trendlines, often leading to an upward breakout
Immunic AG
US
Market Cap: 177.86M
Industry: Biotechnology
Ascending Triangle BreakOut
2/10/2026
Bullish pattern with converging upward trendlines, often leading to an upward breakout
Ares Commercial Real Estate Corp
US
Market Cap: 306.08M
Industry: REIT - Mortgage
Ascending Triangle BreakOut
2/10/2026
Bullish pattern with converging upward trendlines, often leading to an upward breakout
So-Young International Inc
CN
Market Cap: 446.47M
Industry: Health Information Services
Ascending Triangle BreakOut
2/9/2026
Bullish pattern with converging upward trendlines, often leading to an upward breakout
Clean Energy Fuels Corp
US
Market Cap: 552.61M
Industry: Oil & Gas Refining & Marketing
Ascending Triangle BreakOut
2/5/2026
Bullish pattern with converging upward trendlines, often leading to an upward breakout
FutureFuel Corp
US
Market Cap: 159.88M
Industry: Specialty Chemicals
Ascending Triangle BreakOut
2/4/2026
Bullish pattern with converging upward trendlines, often leading to an upward breakout
Saul Centers Inc
US
Market Cap: 841.37M
Industry: REIT - Retail
Ascending Triangle BreakOut
2/4/2026
Bullish pattern with converging upward trendlines, often leading to an upward breakout
SAB Biotherapeutics Inc
US
Market Cap: 343.38M
Industry: Biotechnology
Ascending Triangle BreakOut
1/28/2026
Bullish pattern with converging upward trendlines, often leading to an upward breakout
Want to see more technical patterns?
Access our full platform with advanced filtering, real-time alerts, and comprehensive market analysis.
View Full Platform →About Ascending Triangle BreakOut Patterns
Ascending Triangle BreakOut patterns are technical chart formations that traders and investors use to identify potential entry and exit points. These patterns are based on historical price movements and can help predict future price direction.
Understanding the Triangle Bullish Breakout in Stocks
What is the Triangle Bullish Breakout Pattern in Stocks?
The Triangle Bullish Breakout pattern is a continuation pattern that appears during an uptrend, indicating a potential continuation of the upward movement. This pattern forms when the price of a stock consolidates within converging trendlines, creating a triangular shape, before breaking out to the upside. In stock trading, the Triangle Bullish Breakout pattern is significant because it often signals the continuation of a bullish trend. Recognizing this pattern can help traders anticipate price movements and make strategic trades.
How to Identify Triangle Bullish Breakout Patterns
Identifying the Triangle Bullish Breakout pattern involves several key steps:
- Uptrend: Look for a clear uptrend leading into the pattern.
- Consolidation: The price consolidates within converging trendlines, forming a triangle.
- Breakout: The price breaks above the upper trendline, confirming the pattern.
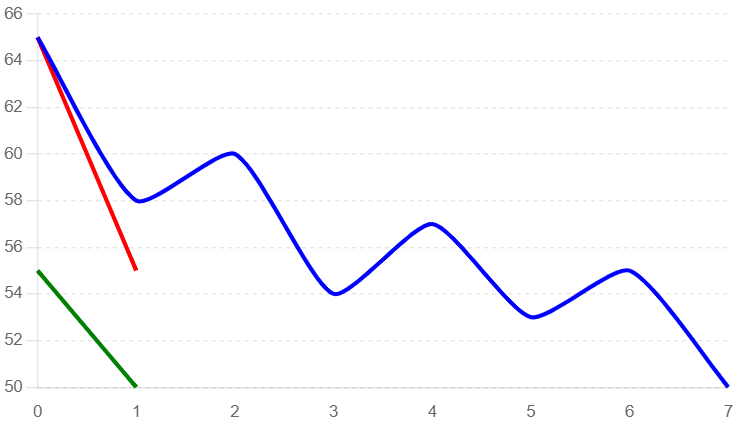
Identifying a Triangle Bullish Breakout Pattern
In this example, we use a typical candlestick chart to illustrate the formation of a Triangle Bullish Breakout pattern. Key elements to observe include the uptrend, the consolidation phase, and the subsequent breakout.
- Uptrend: The price of the stock shows a clear upward trend leading into the pattern.
- Consolidation: The price consolidates within converging trendlines, forming a triangle.
- Breakout Confirmation: The price breaks above the upper trendline, confirming the pattern.
Triangle Bullish Breakout Pattern
Key Indicators
- Volume Spikes: Increased trading volume often accompanies the breakout, indicating strong buying interest.
- Trendlines: Converging trendlines forming the triangle.
- Candlestick Patterns: Look for bullish candlestick patterns near the breakout point.
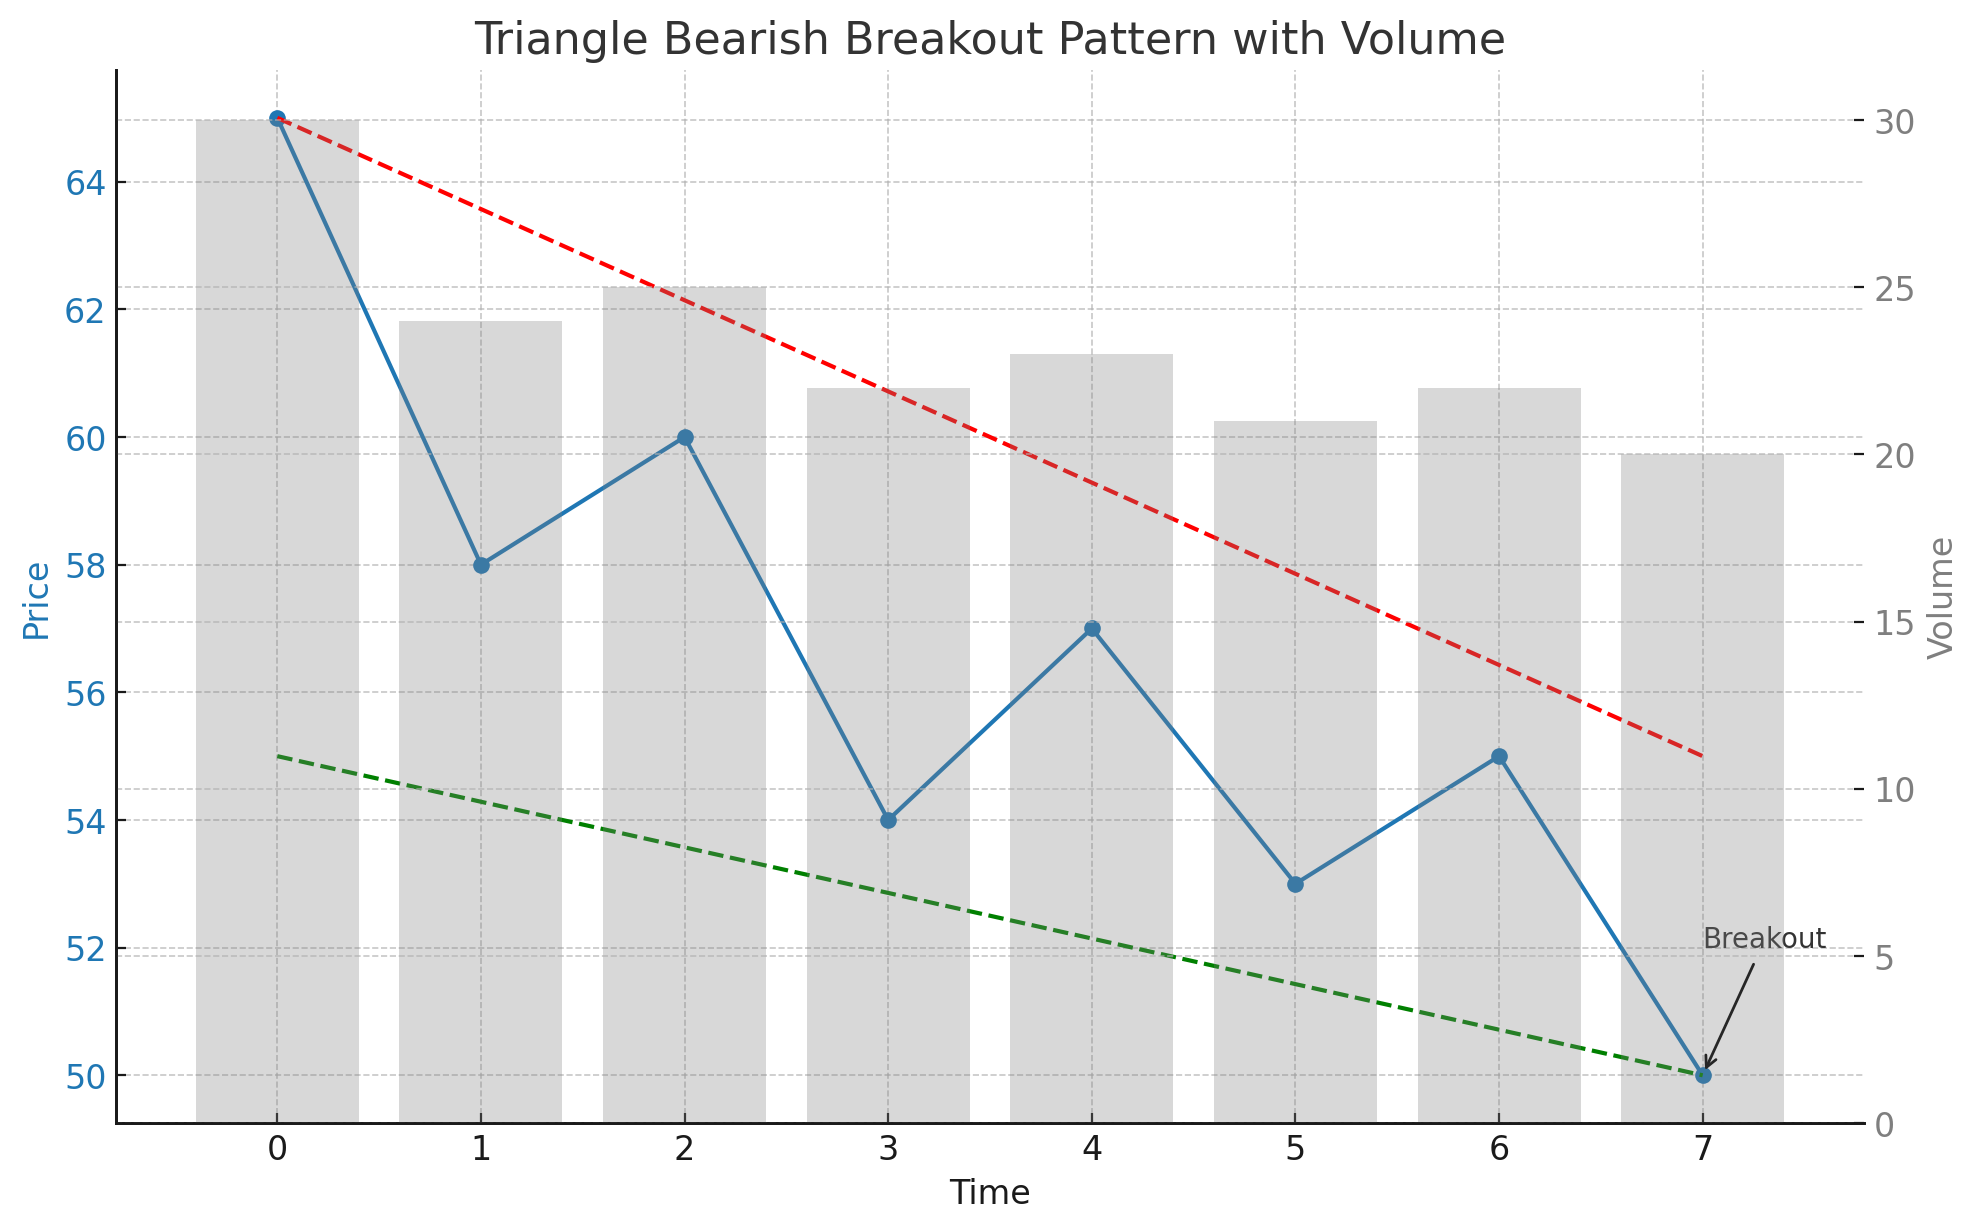
Triangle Bullish Breakout Pattern with Volume Analysis
This example highlights the role of volume in confirming the Triangle Bullish Breakout pattern. Volume analysis can provide additional confidence in the pattern's validity.
- Uptrend: The price trend is upward, characterized by increasing prices and moderate volume.
- Consolidation: The price consolidates within converging trendlines with moderate volume.
- Breakout: The price breaks above the upper trendline with a significant spike in volume, confirming the pattern.
Triangle Bullish Breakout Pattern with Volume
Frequently Asked Questions
What is the Triangle Bullish Breakout pattern in stock trading?
The Triangle Bullish Breakout pattern in stock trading is a continuation pattern that appears during an uptrend. It indicates a potential continuation of the upward movement and is characterized by the price consolidating within converging trendlines before breaking out to the upside.
How reliable is the Triangle Bullish Breakout pattern in stocks?
The Triangle Bullish Breakout pattern is considered a reliable bullish continuation signal in stock trading, especially when confirmed by increased trading volume and a strong breakout above the upper trendline. However, it should be used alongside other technical analysis tools.
Can the Triangle Bullish Breakout pattern appear in any stock?
Yes, the Triangle Bullish Breakout pattern can appear in any stock. It is a widely applicable chart pattern used in technical analysis across various assets, including stocks.
What common mistakes should be avoided when trading the Triangle Bullish Breakout pattern?
Common mistakes include entering the trade too early before the breakout confirmation, not confirming the pattern with volume analysis, and failing to set appropriate stop-loss levels to manage risk. By understanding and utilizing the Triangle Bullish Breakout pattern, traders can better anticipate bullish continuations and optimize their trading strategies for improved outcomes in the stock market.
What are the key indicators to consider when trading the Triangle Bullish Breakout pattern in stocks?
Key indicators include identifying significant trendlines, confirming the pattern with increased volume during the breakout, and observing bullish candlestick patterns near the breakout point. These indicators help validate the Triangle Bullish Breakout pattern and provide insights for potential significant price movements.