Ascending Triangle BreakDown Technical Pattern
Learn about the Triangle Bearish Breakout pattern in stock trading - a continuation pattern that signals potential downward movement. Understand how to identify and trade this technical analysis pattern effectively with volume analysis and key indicators.
Recent Ascending Triangle BreakDown Patterns
15 patterns found
Acres Commercial Realty Corp
US
Market Cap: 130.52M
Industry: REIT - Mortgage
Ascending Triangle BreakDown
3/27/2026
Bearish pattern with converging downward trendlines, often leading to a downward breakout
HIGH TIDE INC
CA
Market Cap: 218.72M
Industry: Medical - Pharmaceuticals
Ascending Triangle BreakDown
3/19/2026
Bearish pattern with converging downward trendlines, often leading to a downward breakout
Braemar Hotel & Resorts Inc
US
Market Cap: 152.32M
Industry: REIT - Hotel & Motel
Ascending Triangle BreakDown
3/16/2026
Bearish pattern with converging downward trendlines, often leading to a downward breakout
Plus Therapeutics Inc
US
Market Cap: 50.87M
Industry: Biotechnology
Ascending Triangle BreakDown
3/13/2026
Bearish pattern with converging downward trendlines, often leading to a downward breakout
KNOT OFFSHORE PARTNERS LP
GB
Market Cap: 351.07M
Industry: Marine Shipping
Ascending Triangle BreakDown
3/13/2026
Bearish pattern with converging downward trendlines, often leading to a downward breakout
ALDEYRA THERAPEUTICS INC
US
Market Cap: 280.96M
Industry: Biotechnology
Ascending Triangle BreakDown
3/13/2026
Bearish pattern with converging downward trendlines, often leading to a downward breakout
Ovh Groupe SAS
FR
Market Cap: 1.58B
Industry: Software - Infrastructure
Ascending Triangle BreakDown
3/11/2026
Bearish pattern with converging downward trendlines, often leading to a downward breakout
ABG Sundal Collier Holding ASA
NO
Market Cap: 463.55M
Industry: Financial - Capital Markets
Ascending Triangle BreakDown
3/9/2026
Bearish pattern with converging downward trendlines, often leading to a downward breakout
MOBILE INFRASTRUCTURE CORP
US
Market Cap: 105.79M
Industry: Real Estate - General
Ascending Triangle BreakDown
3/6/2026
Bearish pattern with converging downward trendlines, often leading to a downward breakout
Metcash Ltd
AU
Market Cap: 2.37B
Industry: Food Distribution
Ascending Triangle BreakDown
3/5/2026
Bearish pattern with converging downward trendlines, often leading to a downward breakout
ABEONA THERAPEUTICS INC
US
Market Cap: 285.05M
Industry: Medical - Pharmaceuticals
Ascending Triangle BreakDown
3/3/2026
Bearish pattern with converging downward trendlines, often leading to a downward breakout
Banco de Sabadell S.A
ES
Market Cap: 65.45B
Industry: Banks - Diversified
Ascending Triangle BreakDown
3/3/2026
Bearish pattern with converging downward trendlines, often leading to a downward breakout
BRITISH LAND CO PLC
GB
Market Cap: 5.71B
Industry: REIT - Diversified
Ascending Triangle BreakDown
3/3/2026
Bearish pattern with converging downward trendlines, often leading to a downward breakout
indie Semiconductor Inc
US
Market Cap: 737.51M
Industry: Halbleiter Zubehör & Materialien
Ascending Triangle BreakDown
2/19/2026
Bearish pattern with converging downward trendlines, often leading to a downward breakout
VRG S.A.
PL
Market Cap: 329.05M
Industry: Apparel Manufacturing
Ascending Triangle BreakDown
2/18/2026
Bearish pattern with converging downward trendlines, often leading to a downward breakout
Want to see more technical patterns?
Access our full platform with advanced filtering, real-time alerts, and comprehensive market analysis.
View Full Platform →About Ascending Triangle BreakDown Patterns
Ascending Triangle BreakDown patterns are technical chart formations that traders and investors use to identify potential entry and exit points. These patterns are based on historical price movements and can help predict future price direction.
Understanding the Triangle Bearish Breakout in Stocks
What is the Triangle Bearish Breakout Pattern in Stocks?
The Triangle Bearish Breakout pattern is a continuation pattern that appears during a downtrend, indicating a potential continuation of the downward movement. This pattern forms when the price of a stock consolidates within converging trendlines, creating a triangular shape, before breaking out to the downside. In stock trading, the Triangle Bearish Breakout pattern is significant because it often signals the continuation of a bearish trend. Recognizing this pattern can help traders anticipate price movements and make strategic trades.
How to Identify Triangle Bearish Breakout Patterns
Identifying the Triangle Bearish Breakout pattern involves several key steps:
- Downtrend: Look for a clear downtrend leading into the pattern.
- Consolidation: The price consolidates within converging trendlines, forming a triangle.
- Breakout: The price breaks below the lower trendline, confirming the pattern.
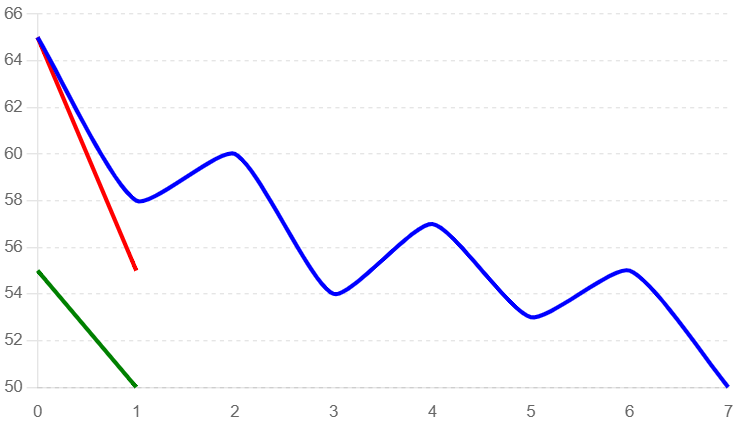
Identifying a Triangle Bearish Breakout Pattern
In this example, we use a typical candlestick chart to illustrate the formation of a Triangle Bearish Breakout pattern. Key elements to observe include the downtrend, the consolidation phase, and the subsequent breakout.
- Downtrend: The price of the stock shows a clear downward trend leading into the pattern.
- Consolidation: The price consolidates within converging trendlines, forming a triangle.
- Breakout Confirmation: The price breaks below the lower trendline, confirming the pattern.
Triangle Bearish Breakout Pattern
Key Indicators
- Volume Spikes: Increased trading volume often accompanies the breakout, indicating strong selling interest.
- Trendlines: Converging trendlines forming the triangle.
- Candlestick Patterns: Look for bearish candlestick patterns near the breakout point.
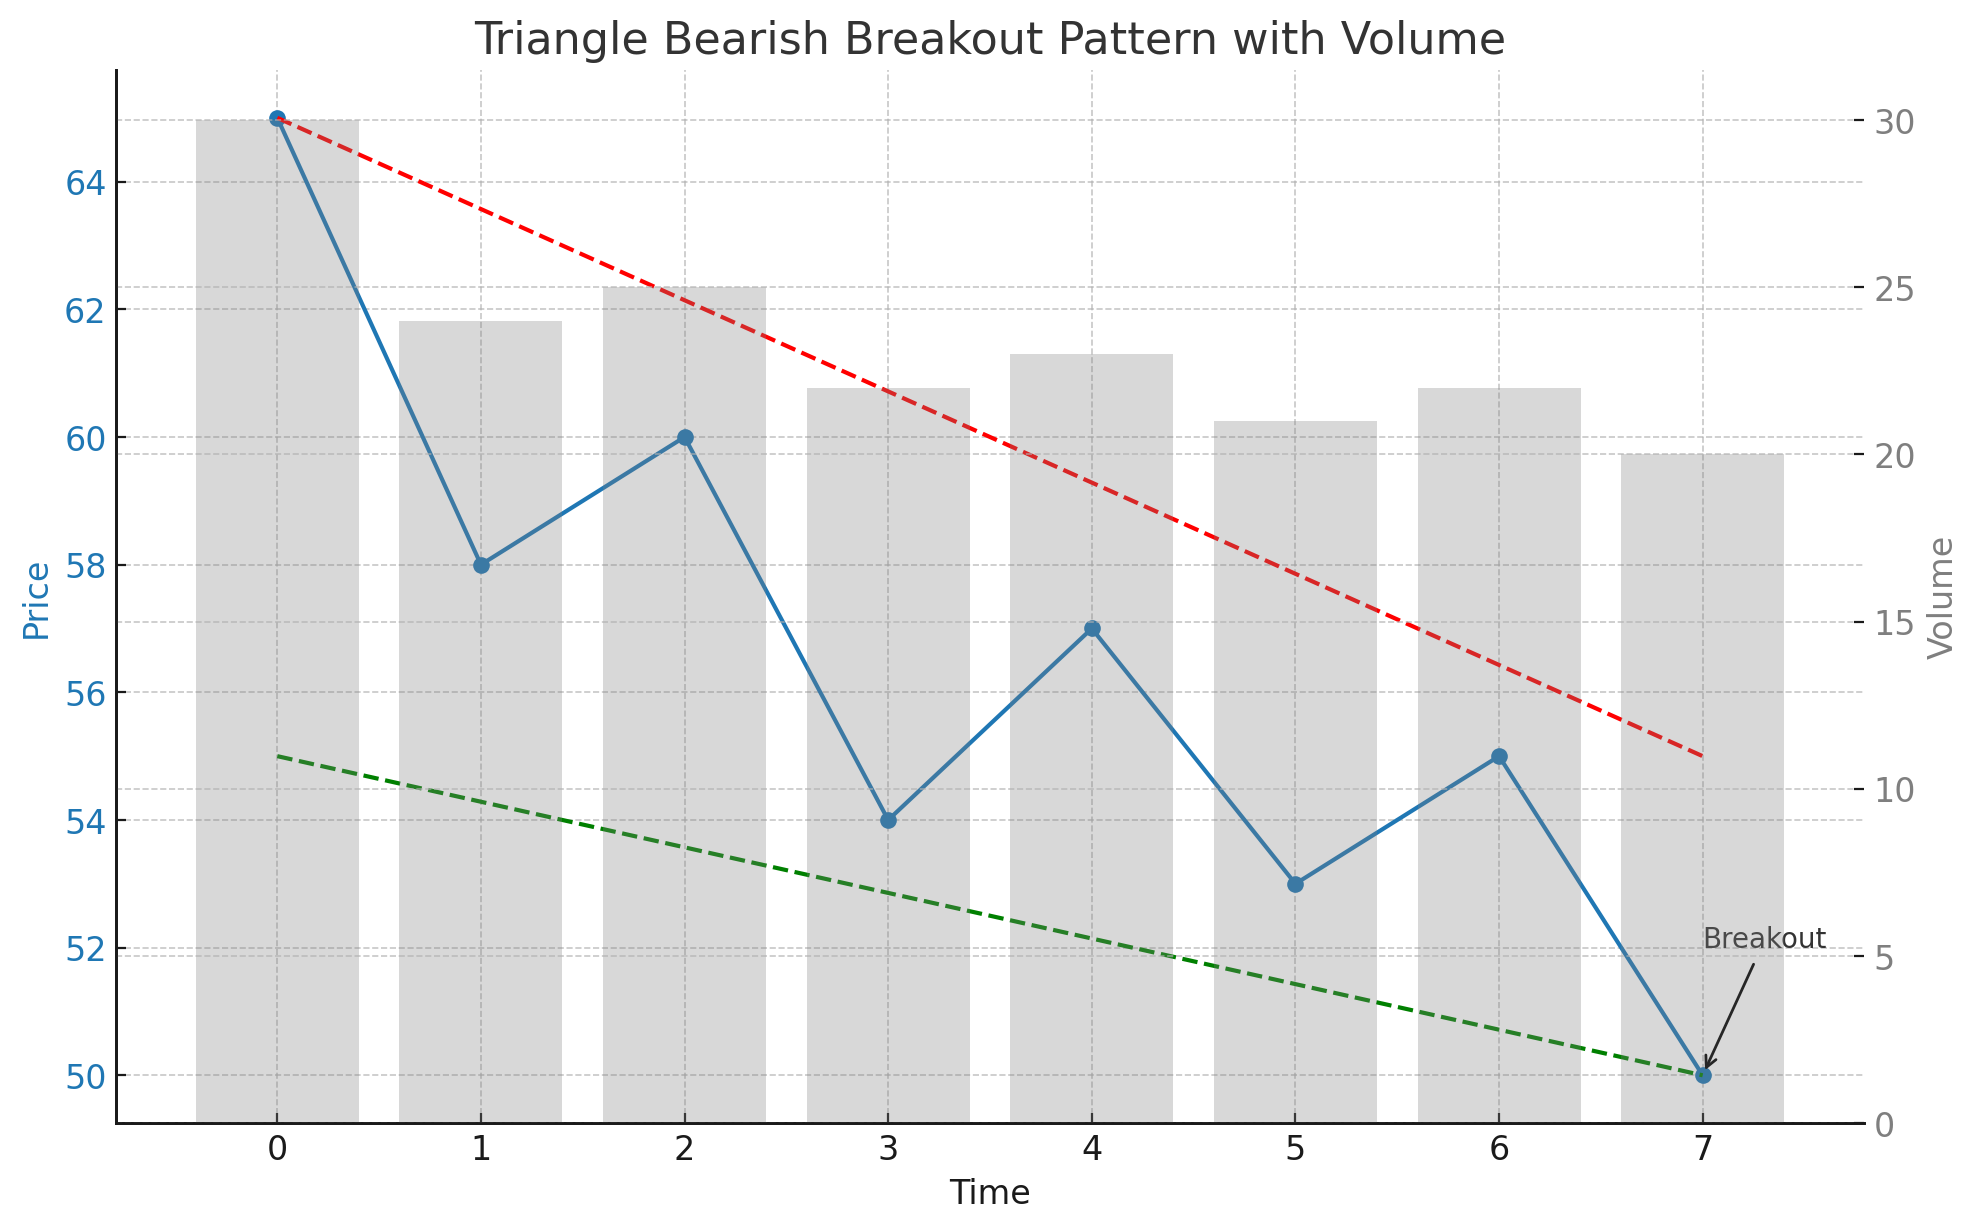
Triangle Bearish Breakout Pattern with Volume Analysis
This example highlights the role of volume in confirming the Triangle Bearish Breakout pattern. Volume analysis can provide additional confidence in the pattern's validity.
- Downtrend: The price trend is downward, characterized by decreasing prices and moderate volume.
- Consolidation: The price consolidates within converging trendlines with moderate volume.
- Breakout: The price breaks below the lower trendline with a significant spike in volume, confirming the pattern.
Triangle Bearish Breakout Pattern with Volume
Frequently Asked Questions
What is the Triangle Bearish Breakout pattern in stock trading?
The Triangle Bearish Breakout pattern in stock trading is a continuation pattern that appears during a downtrend. It indicates a potential continuation of the downward movement and is characterized by the price consolidating within converging trendlines before breaking out to the downside.
How reliable is the Triangle Bearish Breakout pattern in stocks?
The Triangle Bearish Breakout pattern is considered a reliable bearish continuation signal in stock trading, especially when confirmed by increased trading volume and a strong breakout below the lower trendline. However, it should be used alongside other technical analysis tools.
Can the Triangle Bearish Breakout pattern appear in any stock?
Yes, the Triangle Bearish Breakout pattern can appear in any stock. It is a widely applicable chart pattern used in technical analysis across various assets, including stocks.
What common mistakes should be avoided when trading the Triangle Bearish Breakout pattern?
Common mistakes include entering the trade too early before the breakout confirmation, not confirming the pattern with volume analysis, and failing to set appropriate stop-loss levels to manage risk. By understanding and utilizing the Triangle Bearish Breakout pattern, traders can better anticipate bearish continuations and optimize their trading strategies for improved outcomes in the stock market.
What are the key indicators to consider when trading the Triangle Bearish Breakout pattern in stocks?
Key indicators include identifying significant trendlines, confirming the pattern with increased volume during the breakout, and observing bearish candlestick patterns near the breakout point. These indicators help validate the Triangle Bearish Breakout pattern and provide insights for potential significant price movements.